This paper investigates the positions of Cataclysmic Variables (CVs) in the Hertzsprung-Russell diagram using Gaia data, revealing a trend where shorter orbital periods correlate with bluer and fainter CVs. It also identifies the locations of various CV sub-types and discusses the potential positions of detached CVs within the orbital period gap.
Cataclysmic Variables (CVs) are interacting binaries consisting of at least three components that control their colour and magnitude. Using Gaia we here investigate the influence of the physical properties of these binaries on their position in the Hertzsprung-Russell diagram (HR-diagram). The CVs are on average located between the main sequence and the white dwarf regime, the maximum density being at $G_{BP}-G_{RP} \sim 0.56$ and $G_{abs} \sim 10.15$. We find a trend of the orbital period with colour and absolute brightness: with decreasing period, the CVs become bluer and fainter. We also identify the location of the various CV sub-types in the HR-diagram and discuss the possible location of detached CVs, going through the orbital period gap.
Generated Sep 02, 2025
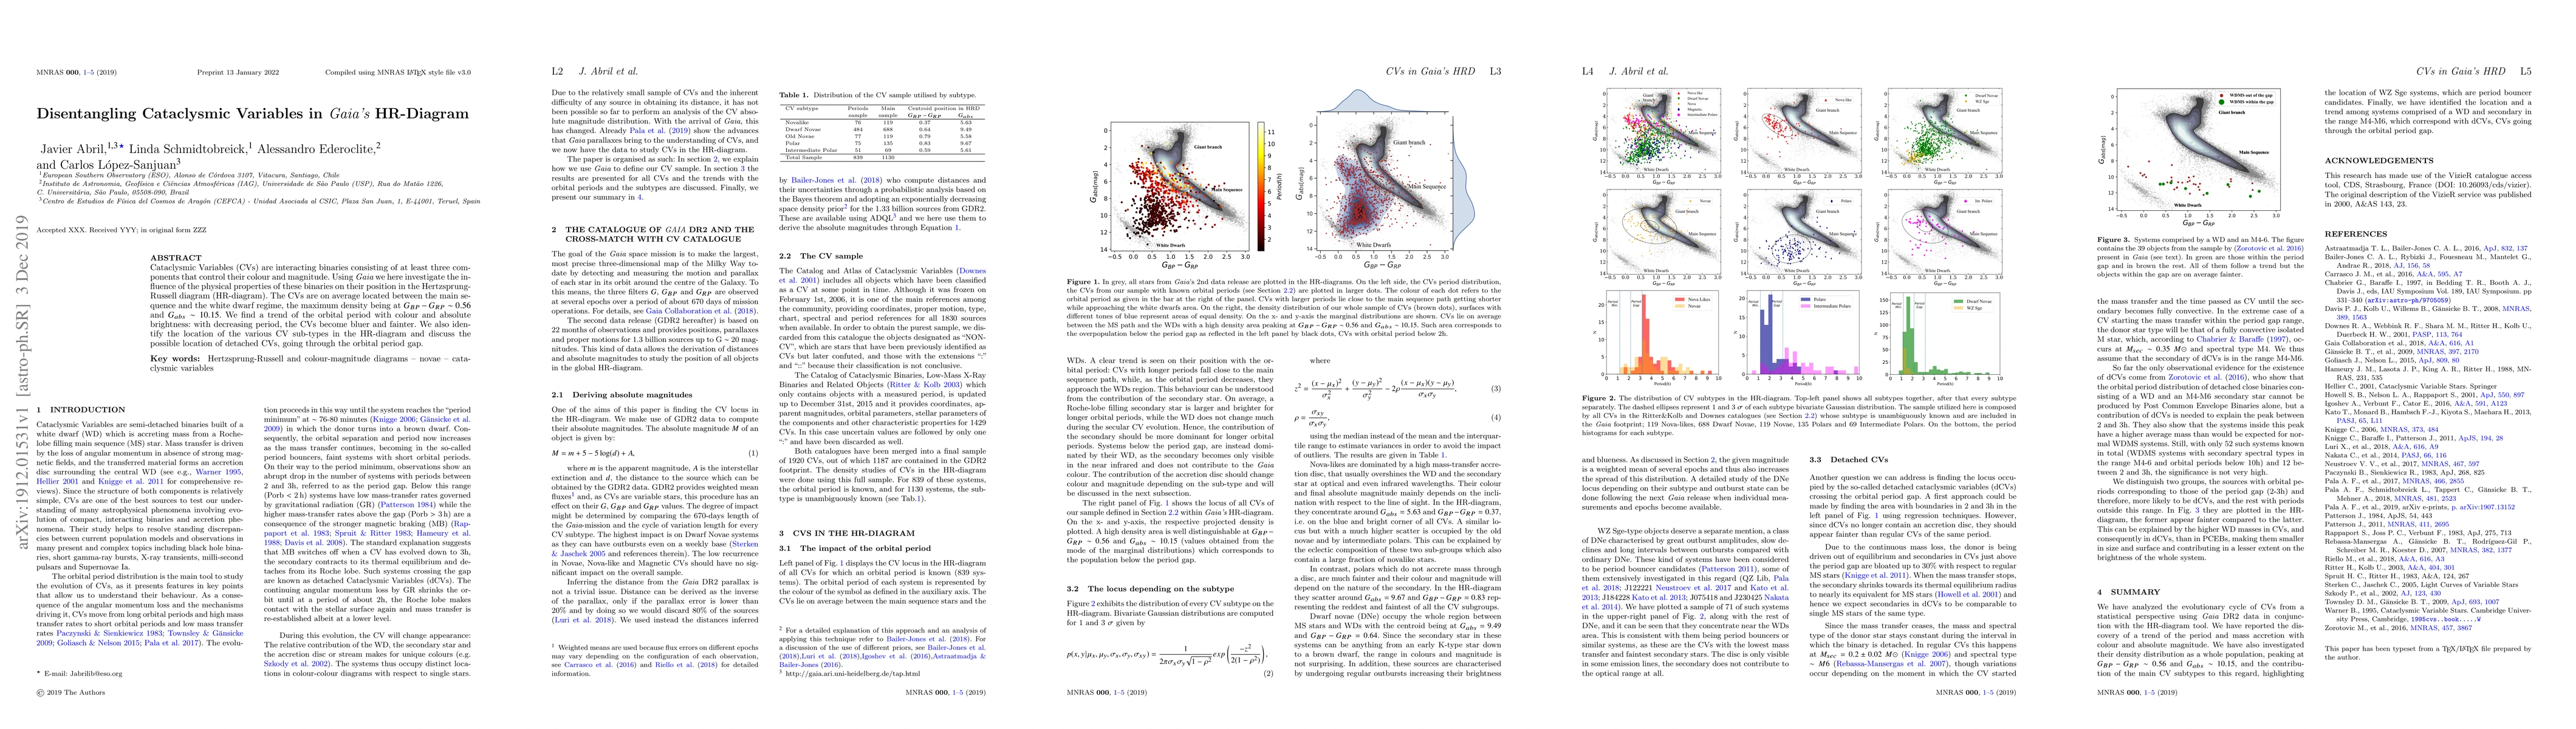
The study utilized Gaia DR2 data to analyze Cataclysmic Variables (CVs) in the Hertzsprung-Russell (HR) diagram, deriving absolute magnitudes using Gaia parallaxes and interstellar extinction estimates. The research focused on the influence of orbital periods and CV subtypes on their position in the HR diagram.
This research provides a statistical perspective on the evolutionary cycle of CVs, revealing trends between orbital period, color, and absolute magnitude. It also contributes to understanding the density distribution and subtypes of CVs, potentially aiding in the identification of detached CVs.
The paper presents a methodology for analyzing CVs in the HR diagram using Gaia DR2 data, providing a comprehensive study of CV trends with orbital periods and subtypes.
This work is novel in its application of Gaia's precise three-dimensional mapping to study CVs in the HR diagram, revealing trends and subtype distributions that were not previously well-characterized.
Current paper (gray), citations (green), references (blue)
Display is limited for performance on very large graphs.
Title | Authors | Year | Actions |
---|
Comments (0)