Dissecting graph measure performance for node clustering in LFR parameter space
Publication
Metrics
Paper Preview
Abstract
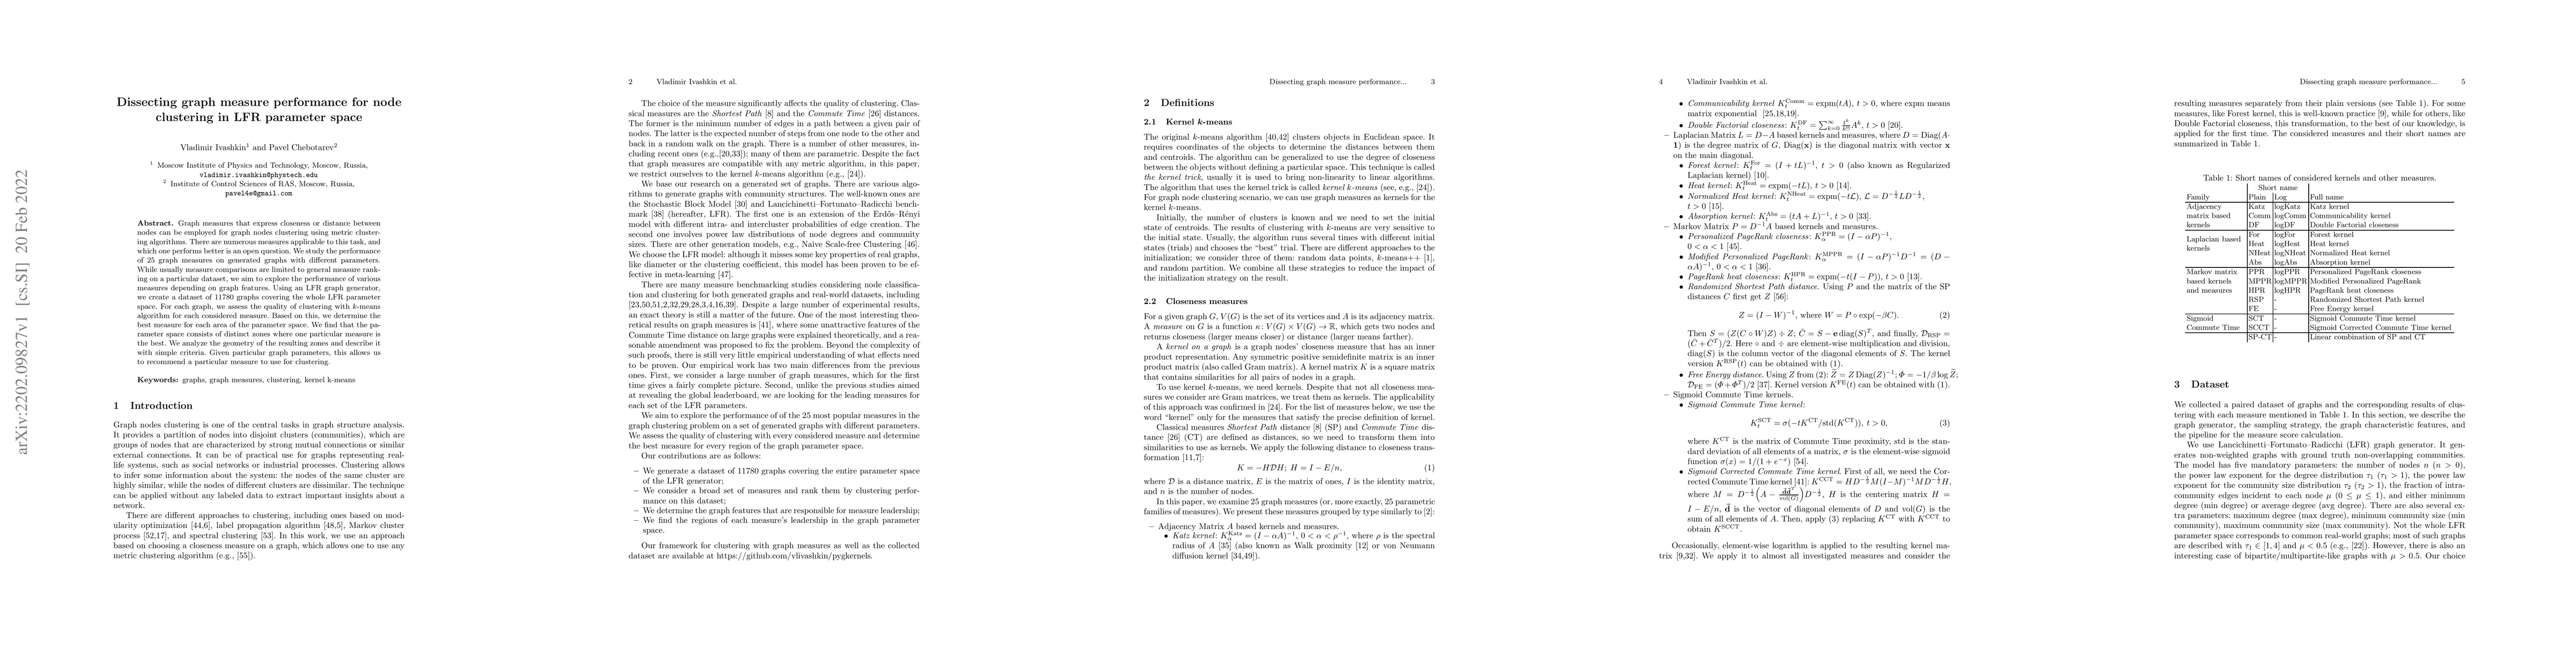
Graph measures that express closeness or distance between nodes can be employed for graph nodes clustering using metric clustering algorithms. There are numerous measures applicable to this task, and which one performs better is an open question. We study the performance of 25 graph measures on generated graphs with different parameters. While usually measure comparisons are limited to general measure ranking on a particular dataset, we aim to explore the performance of various measures depending on graph features. Using an LFR graph generator, we create a dataset of 11780 graphs covering the whole LFR parameter space. For each graph, we assess the quality of clustering with k-means algorithm for each considered measure. Based on this, we determine the best measure for each area of the parameter space. We find that the parameter space consists of distinct zones where one particular measure is the best. We analyze the geometry of the resulting zones and describe it with simple criteria. Given particular graph parameters, this allows us to recommend a particular measure to use for clustering.
AI Key Findings
Get AI-generated insights about this paper's methodology, results, significance, and more — seven facets brought into focus.
Impact
Paper Details
Authors
PDF Preview
Key Terms
Citation Network
Current paper (gray), citations (green), references (blue)
Display is limited for performance on very large graphs.
Discussion 0