Quantum turbulence is a far-from-equilibrium process characterized by high
nonlinearity. Holographic duality provides a systematic framework for
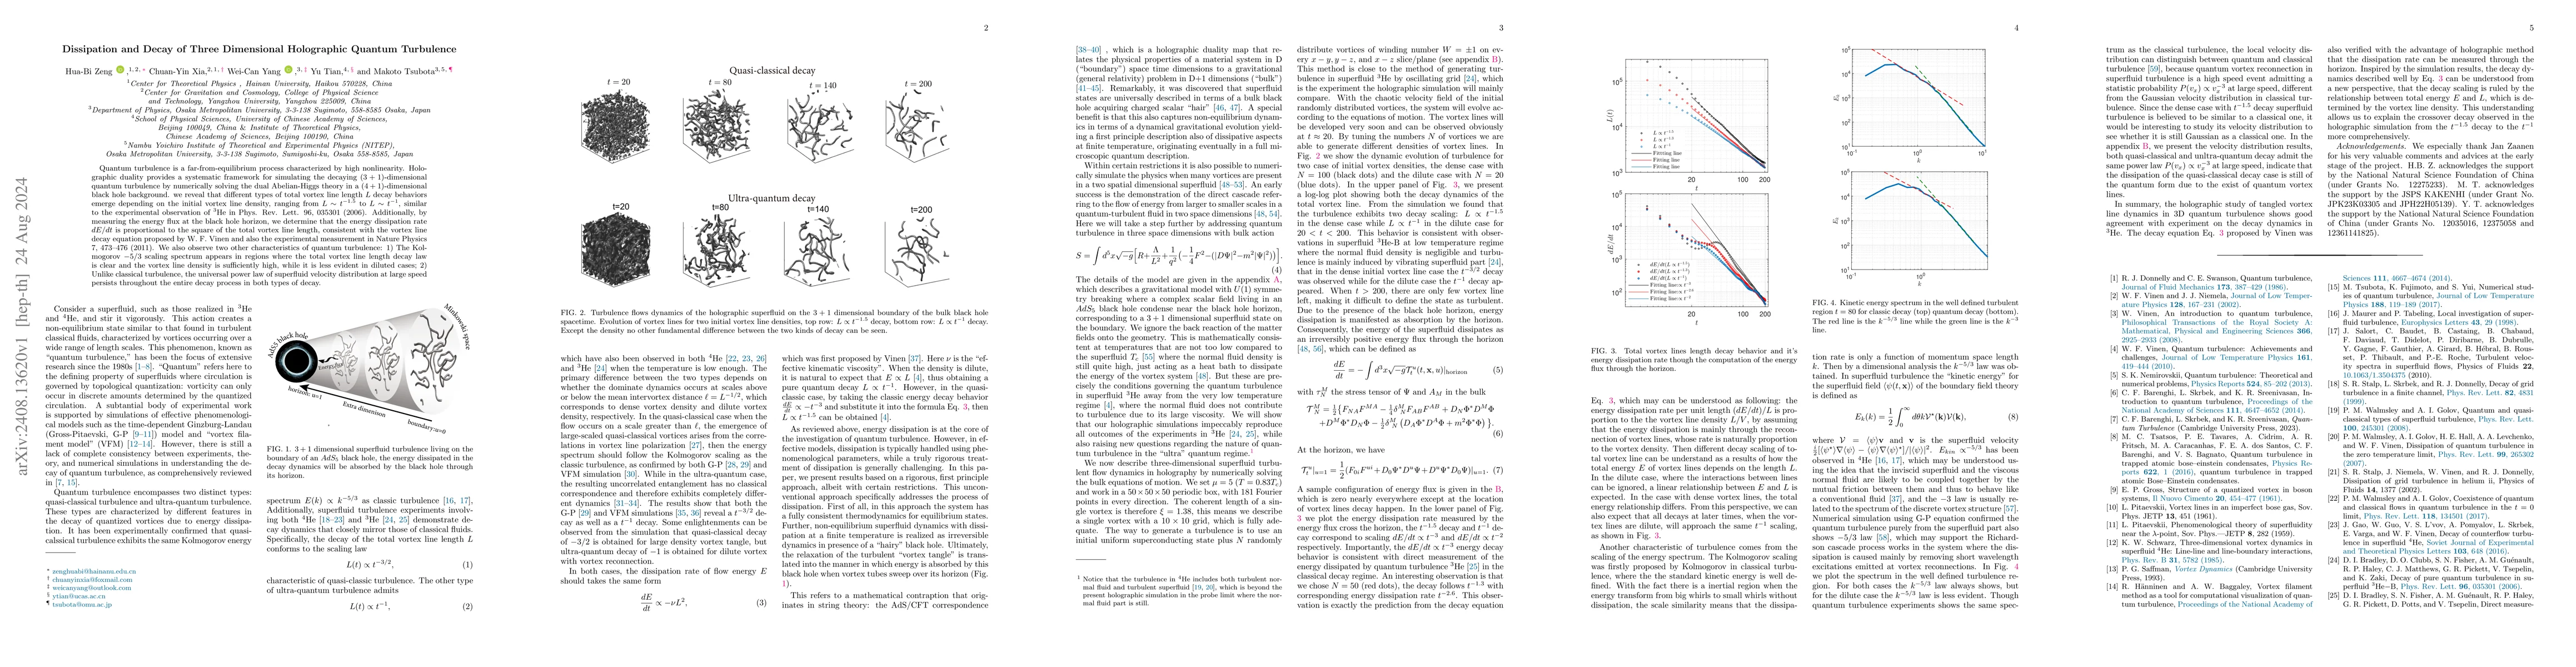
simulating the decaying $(3+1)$-dimensional quantum turbulence by numerically
solving the dual Abelian-Higgs theory in a $(4+1)$-dimensional black hole
background. We reveal that different types of total vortex line length $L$
decay behaviors emerge depending on the initial vortex line density, ranging
from $L\sim t^{-1.5}$ to $L\sim t^{-1}$, similar to the experimental
observation of $^3$He in Phys. Rev. Lett. 96, 035301 (2006). Additionally, by
measuring the energy flux at the black hole horizon, we determine that the
energy dissipation rate $dE/dt$ is proportional to the square of the total
vortex line length, consistent with the vortex line decay equation proposed by
W. F. Vinen and also the experimental measurement in Nature Physics 7, 473-476
(2011). We also observe two other characteristics of quantum turbulence: 1) The
Kolmogorov $-5/3$ scaling spectrum appears in regions where the total vortex
line length decay law is clear and the vortex line density is sufficiently
high, while it is less evident in diluted cases; 2) Unlike classical
turbulence, the universal power law of superfluid velocity distribution at
large speed persists throughout the entire decay process in both types of
decay.
Discussion 0