ArxivLens

Quick Summary:

This paper proposes a distribution-free CUSUM control chart using bootstrap-based control limits for phase II statistical process control when both in-control and out-of-control distributions are unknown. The method eliminates the need for distributional assumptions and improves robustness against different distributional choices.

Journal Reference: Annals of Applied Statistics 2009, Vol. 3, No. 1, 349-369
DOI: 10.1214/08-AOAS197
arXiv Id: 0906.1421
Comments: Published in at http://dx.doi.org/10.1214/08-AOAS197 the Annals of Applied Statistics (http://www.imstat.org/aoas/) by the Institute of Mathematical Statistics (http://www.imstat.org)
Report No: IMS-AOAS-AOAS197
Date Published: 2009-06-09
Date Updated: 2009-06-09

Categories:

Key Terms (TF-IDF):

control (0.366)
control (0.365)
distributions (0.235)
distributions (0.234)
limits (0.230)
limits (0.223)
process (0.222)
process (0.217)
run (0.210)
run (0.207)
assumption (0.188)
assumption (0.187)
length (0.169)
length (0.166)
average (0.163)
average (0.162)
bootstrap (0.157)
nominal (0.153)
nominal (0.153)
statistic (0.150)
License: http://arxiv.org/licenses/nonexclusive-distrib/1.0/

Summary:

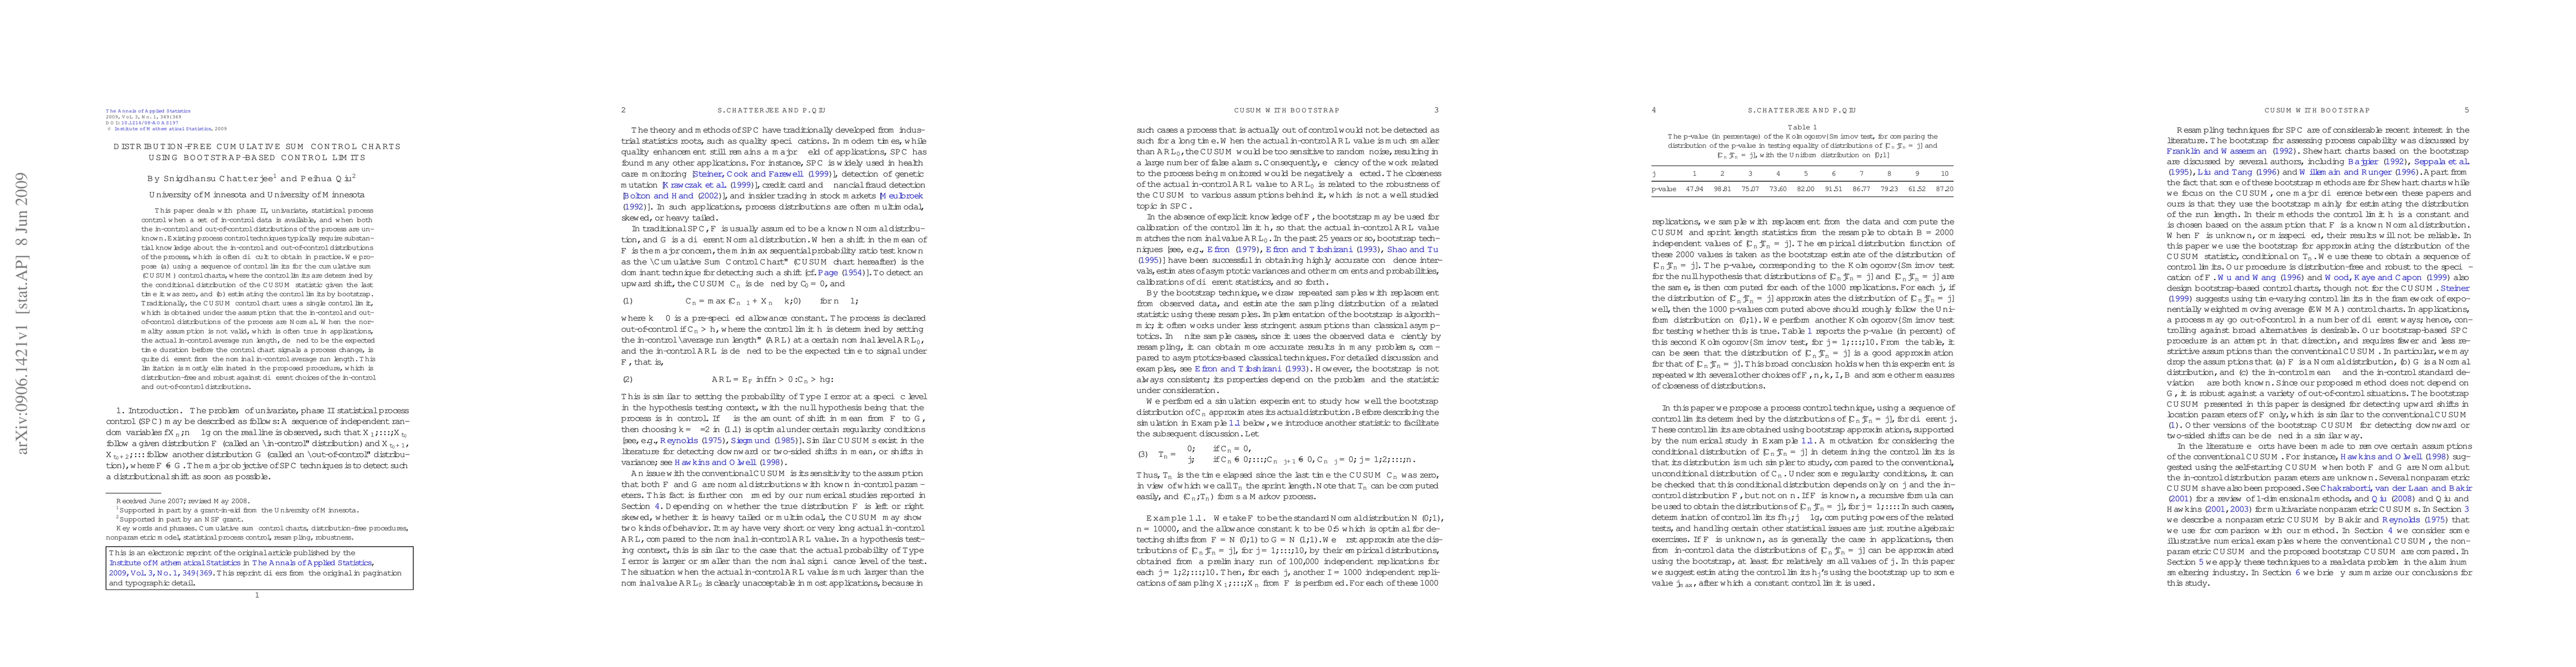
This paper deals with phase II, univariate, statistical process control when a set of in-control data is available, and when both the in-control and out-of-control distributions of the process are unknown. Existing process control techniques typically require substantial knowledge about the in-control and out-of-control distributions of the process, which is often difficult to obtain in practice. We propose (a) using a sequence of control limits for the cumulative sum (CUSUM) control charts, where the control limits are determined by the conditional distribution of the CUSUM statistic given the last time it was zero, and (b) estimating the control limits by bootstrap. Traditionally, the CUSUM control chart uses a single control limit, which is obtained under the assumption that the in-control and out-of-control distributions of the process are Normal. When the normality assumption is not valid, which is often true in applications, the actual in-control average run length, defined to be the expected time duration before the control chart signals a process change, is quite different from the nominal in-control average run length. This limitation is mostly eliminated in the proposed procedure, which is distribution-free and robust against different choices of the in-control and out-of-control distributions.

Citation & Reference Network Visualization

This graph shows how this paper is connected to other research. The current paper is shown in dark gray, papers that cite it are in green, and papers it references are in blue. You can:

Current Paper
Papers citing this work (Citations)
Papers cited by this work (References)

• Hover over any node to see the paper title

• Click a node to view that paper's details

• Drag nodes to rearrange the graph

• Use the zoom controls (bottom right) to zoom in/out

Citations and References

Title Authors Year Actions
An efficient and unified statistical monitoring framework for multivariate autocorrelated processes
Kai Wang, Wanlin Xu, Jian Li
2024
View Paper
Auto-Correlated Multivariate Quality Control for Electronic Products Manufacturing with Decomposition Analysis
Luh Juni Asrini, Dian Retno Sari Dewi, Irene Karijadi
2024
View Paper
Online monitoring of air quality using PCA-based sequential learning
Xiulin Xie, Nicole Qian, Peihua Qiu
2024
View Paper
Novel nonparametric control charts for monitoring dispersion of count data
Zhiqiong Wang, Qingxia Wu, Peihua Qiu
2023
View Paper
Phase II control charts for monitoring the depth-ratio of ball-bearings involving three normal variables.
Li Jin, A. Mukherjee, Zhi Song, Jiujun Zhang
2023
View Paper
A Control Chart for Monitoring Multivariate Spatiotemporal Correlated Data During Grain Storage
Xingyu Wang, Di Wang
2023
View Paper
An CUSUM Test with Observation-Adjusted Control Limits in Change Detection
F. Tang, D. Han
2023
View Paper
Control charts for dynamic process monitoring with an application to air pollution surveillance
Xiulin Xie, P. Qiu
2023
View Paper
Multivariate auto‐correlated process control by a residual‐based mixed CUSUM‐EWMA model
Kung-Jeng Wang, Luh Juni Asrini
2023
View Paper
Online monitoring of high-dimensional asynchronous and heterogeneous data streams for shifts in location and scale
Honghan Ye, Ziqian Zheng, Jing-Ru C. Cheng, Brock Hable, Kaibo Liu
2023
View Paper
A robust adaptive exponentially weighted moving average control chart with a distribution-free design strategy
Yifan Li, Jinhua Qin, Chunjie Wu
2023
View Paper
Aggregated parameter update schemes for monitoring binary profiles
Yifan Li, Chunjie Wu, Zhijun Wang, Zhiming Hu
2023
View Paper
A Generic Online Nonparametric Monitoring and Sampling Strategy for High-Dimensional Heterogeneous Processes
Honghan Ye, Kaibo Liu
2022
View Paper
Deep learning-based automatic optical inspection system empowered by online multivariate autocorrelated process control
Kung-Jeng Wang, Luh Juni Asrini
2022
View Paper
Online nonparametric monitoring of heterogeneous data streams with partial observations based on Thompson sampling
Honghan Ye, Xiaochen Xian, Jing-Ru C. Cheng, Brock Hable, R. W. Shannon, M. K. Elyaderani, Kaibo Liu
2022
View Paper
Classical and the Bayesian estimation of process capability index Cpy: A comparative study
Sumit Kumar
2022
View Paper
Robust online detection in serially correlated directed network
Miaomiao Yu, Yuhao Zhou, F. Tsung
2021
View Paper
Self-starting process monitoring based on transfer learning
Zhijun Wang, Chunjie Wu, Miaomiao Yu, F. Tsung
2021
View Paper
Percentile bootstrap control chart for monitoring process variability under non-normal processes
N. Saeed, S. Kamal, Muhammad Aslam
2021
View Paper
Machine Learning Control Charts for Monitoring Serially Correlated Data
Xiulin Xie, P. Qiu
2021
View Paper
Phase I monitoring of serially correlated nonparametric profiles by mixed‐effects modeling
Qin Zhou, P. Qiu
2021
View Paper
Adaptive CUSUM Location Control Charts Based on Score Functions: An Application in Semiconductor Wafer Field
Babar Zaman, M. Riaz, M. R. Abujiya, Muhammad Hisyam Lee
2021
View Paper
Adaptive CUSUM Location Control Charts Based on Score Functions: An Application in Semiconductor Wafer Field
Babar Zaman, Muhammad Riaz, M. R. Abujiya, Muhammad Hisyam Lee
2021
View Paper
A Gentle Introduction to Conformal Prediction and Distribution-Free Uncertainty Quantification
Anastasios Nikolas Angelopoulos, Stephen Bates
2021
View Paper
Performance evaluation of conventional exponentially weighted moving average (EWMA) and p-value cumulative sum (CUSUM) control chart
O. Ikpotokin, J. Braimah, H. E. Oboh
2021
View Paper
Transparent Sequential Learning for Statistical Process Control of Serially Correlated Data
P. Qiu, Xiulin Xie
2021
View Paper
Distribution-Free CUSUM-Type Control Charts for Monitoring Industrial Processes: An Overview
I. Triantafyllou, M. Ram
2021
View Paper
Design variable-sampling control charts using covariate information
Kai Yang, P. Qiu
2021
View Paper
Some robust approaches based on copula for monitoring bivariate processes and component-wise assessment
Zhi Song, A. Mukherjee, Jiujun Zhang
2021
View Paper
RETRACTED ARTICLE: Monitoring of production of blood components by attribute control chart under indeterminacy
Nasrullah Khan, M. Aslam, P. Jeyadurga, S. Balamurali
2021
View Paper
Large-Scale Datastreams Surveillance via Pattern-Oriented-Sampling
Haojie Ren, Changliang Zou, Nan Chen, Runze Li
2020
View Paper
On unified framework for continuous-time grey models: An integral matching perspective
Bao-lei Wei, Nai-ming Xie
2020
View Paper
Distribution-free hybrid schemes for process surveillance with application in monitoring chlorine content of water
Ridwan A. Sanusi, Z. L. Chong, A. Mukherjee, M. Xie
2020
View Paper
A nonparametric CUSUM chart for monitoring multivariate serially correlated processes
Li Xue, P. Qiu
2020
View Paper
Adaptive Process Monitoring Using Covariate Information
Kai Yang, P. Qiu
2020
View Paper
A robust dynamic screening system by estimation of the longitudinal data distribution
L. You, P. Qiu
2020
View Paper
A setwise EWMA scheme for monitoring high-dimensional datastreams
Long Feng, Haojie Ren, Changliang Zou
2020
View Paper
Time course of cognitive training in Parkinson disease.
Hoang M Nguyen, A. Aravindakshan, Jessica M. Ross, E. Disbrow
2020
View Paper
Correlation-based dynamic sampling for online high dimensional process monitoring
M. Nabhan, Y. Mei, Jianjun Shi
2020
View Paper
A general charting scheme for monitoring serially correlated data with short-memory dependence and nonparametric distributions
Wendong Li, P. Qiu
2020
View Paper
Constructing a Control Chart Using Functional Data
Miguel Flores, S. Naya, R. Fernández-Casal, S. Zaragoza, P. Raña, J. Tarrío‐Saavedra
2020
View Paper
Some simplified Shewhart-type distribution-free joint monitoring schemes and its application in monitoring drinking water turbidity
Z. L. Chong, A. Mukherjee, M. Khoo
2020
View Paper
Comparisons of some distribution-free CUSUM and EWMA schemes and their applications in monitoring impurity in mining process flotation
A. Mukherjee, Z. L. Chong, M. Khoo
2019
View Paper
Control Limits for an Adaptive Self-Starting Distribution-Free CUSUM Based on Sequential Ranks
M. Lang
2019
View Paper
The CUSUM Median Chart for Known and Estimated Parameters
P. Castagliola, Fernanda Figueiredo, P. Maravelakis
2019
View Paper
A Bayesian control chart for monitoring the ratio of Weibull percentiles
P. Erto, A. Lepore, B. Palumbo, A. Vanacore
2019
View Paper
A data‐driven approach to detecting change points in linear regression models
V. Lyubchich, T. V. Lebedeva, J. Testa
2019
View Paper
Nonparametric cost‐minimized Shewhart‐type process monitoring with restricted false alarm probability
Chenglong Li, A. Mukherjee
2019
View Paper
A New Process Control Chart for Monitoring Short-Range Serially Correlated Data
P. Qiu, Wendong Li, Jun Yu Li
2019
View Paper
CUSUM ARL - Conditional or Unconditional?
F. Lombard, D. Hawkins
2019
View Paper
References
2019
View Paper
Nonparametric monitoring of multiple count data
P. Qiu, Zhen He, Zhiqiong Wang
2019
View Paper
Some simultaneous progressive monitoring schemes for the two parameters of a zero-inflated Poisson process under unknown shifts
A. Mukherjee, A. Rakitzis
2019
View Paper
A Fast and Robust Nonparametric Monitoring Scheme for Free-Form Surface Scanning Data
Kai Wang, F. Tsung
2019
View Paper
An empirical likelihood-based CUSUM for on-line model change detection
Ghislain Verdier
2019
View Paper
Automatic Near Real-Time Outlier Detection and Correction in Cardiac Interbeat Interval Series for Heart Rate Variability Analysis: Singular Spectrum Analysis-Based Approach
M. Lang
2019
View Paper
Fast computing for dynamic screening systems when analyzing correlated data
L. You, P. Qiu
2018
View Paper
Parametric bootstrap process capability index control charts for both mean and dispersion
Jiaqing Xu, Cheng Peng
2018
View Paper
A control scheme for monitoring process covariance matrices with more variables than observations
Zhonghua Li, F. Tsung
2018
View Paper
Robust bootstrap control charts for percentiles based on model selection approaches
Jyun-You Chiang, Y. Lio, H. Ng, Tzong-Ru Tsai, Ting Li
2018
View Paper
Count data monitoring: Parametric or nonparametric?
Zhiqiong Wang, P. Qiu
2018
View Paper
An explanatory study on the non-parametric multivariate T2 control chart
A. Mostajeran, N. Iranpanah, R. Noorossana
2018
View Paper
Nonparametric Dynamic Curve Monitoring
P. Qiu, Xuemin Zi, Changliang Zou
2018
View Paper
Rank-based EWMA procedure for sequentially detecting changes of process location and variability
Zhonghua Li, M. Xie, Maoyuan Zhou
2018
View Paper
Phase I Monitoring of Spatial Surface Data from 3D Printing
Yangyang Zang, P. Qiu
2018
View Paper
A Low-Complexity Model-Free Approach for Real-Time Cardiac Anomaly Detection Based on Singular Spectrum Analysis and Nonparametric Control Charts
M. Lang
2018
View Paper
A control chart based on weighted bootstrap with strata
Shih-Chou Kao
2018
View Paper
On the Bootstrap P-Value Method in Identifying out of Control Signals in Multivariate Control Chart
O. Ikpotokin
2018
View Paper
Distribution-free runs-based control charts
Tung-Lung Wu
2018
View Paper
Some perspectives on nonparametric statistical process control
P. Qiu
2018
View Paper
Properties and enhancements of robust likelihood CUSUM control chart
Chunjie Wu, Miaomiao Yu, Zhuang Fang
2017
View Paper
An evaluation of the multivariate dispersion charts with estimated parameters under non-normality
A. Mostajeran, N. Iranpanah, R. Noorossana
2017
View Paper
DOUBLE BOOTSTRAP CONTROL CHART FOR MONITORING SUKUK VOLATILITY AT BURSA MALAYSIA
Muhamad Safiih Lola, N. H. Zainuddin, Mohd Noor Afiq Ramlee, Hizir Sofyan
2017
View Paper
A distribution-free multivariate CUSUM control chart using dynamic control limits
Wenjuan Liang, X. Pu, D. Xiang
2017
View Paper
A Cramér-von Mises test-based distribution-free control chart for joint monitoring of location and scale
Jiujun Zhang, Erjie Li, Zhonghua Li
2017
View Paper
A nonparametric adaptive sampling strategy for online monitoring of big data streams
Xiaochen Xian, Andi Wang, Kaibo Liu
2017
View Paper
spcadjust: An R Package for Adjusting for Estimation Error in Control Charts
A. Gandy, J. Kvaløy
2017
View Paper
Key Economic Sector Nexus and their Granger Causality with Electricity in Tanzania
Emmanuel Ngereja
2016
View Paper
A Distribution-Free Multivariate Control Chart
Nan Chen, Xuemin Zi, Changliang Zou
2016
View Paper
Bootstrap tekniğine bağlı kümülatif toplam kontrol grafiklerinde değişim noktası analizi
Meral Yay, Nihan Acar Denizli, Belchin Kostov
2016
View Paper
A New Bootstrap Based Algorithm for Hotelling’s T2 Multivariate Control Chart
A. Mostajeran, N. Iranpanah, R. Noorossana
2016
View Paper
Optimal design of a distribution-free quality control scheme for cost-efficient monitoring of unknown location
Chenglong Li, A. Mukherjee, Q. Su, M. Xie
2016
View Paper
Statistical monitoring-based alarming systems in modeling the AIDS epidemic in the United States, 1985-2011.
Jingnan Zhang, P. Qiu, X. Chen
2016
View Paper
Another Look at the EWMA Control Chart with Estimated Parameters
Nesma A. Saleh, Mahmoud A. Mahmoud, L. A. Jones‐Farmer, I. Zwetsloot, W. Woodall
2015
View Paper
A nonparametric cumulative sum scheme based on sequential ranks and adaptive control limits
M. Lang, A. Zoubir
2015
View Paper
An Adaptive Sampling Strategy for Online High-Dimensional Process Monitoring
Kaibo Liu, Y. Mei, Jianjun Shi
2015
View Paper
Nonparametric CUSUM Control Charts and Their Use in Two-Stage SPC Applications
Tatevik Ambartsoumian, Daniel R. Jeske
2015
View Paper
On Phase II SPC in Cases When Normality is Invalid
P. Qiu, Jingnan Zhang
2015
View Paper
Distribution‐free Phase II CUSUM Control Chart for Joint Monitoring of Location and Scale
S. Chowdhury, A. Mukherjee, S. Chakraborti
2015
View Paper
Instability and change detection in exponential families and generalized linear models, with a study of Atlantic tropical storms
Y. Lu, Snigdhansu Chatterjee
2014
View Paper
Monitoring analytical measurements in presence of two component measurement error
S. Abbasi
2014
View Paper
Design and implementation of CUSUM exceedance control charts for unknown location
M. A. Graham, S. Chakraborti, A. Mukherjee
2014
View Paper
Statistical Process Control Using a Dynamic Sampling Scheme
Zhonghua Li, P. Qiu
2014
View Paper
Détection et classification de signatures temporelles CAN pour l’aide à la maintenance de sous-systèmes d’un véhicule de transport collectif
N. Cheifetz
2013
View Paper
Data fusion for system modeling, performance assessment and improvement
Kaibo Liu
2013
View Paper
A Semi‐empirical Bayesian Chart to Monitor Weibull Percentiles
P. Erto, G. Pallotta, C. Mastrangelo
2013
View Paper
Phase I Distribution-Free Analysis of Multivariate Data
G. Capizzi, G. Masarotto
2013
View Paper
Phase I Distribution-Free Analysis of Univariate Data
G. Capizzi, G. Masarotto
2013
View Paper
Effect of sample size and number of boostrap samples
I. C. Ramírez, Carlos Javier Barrera, J. C. Correa
2013
View Paper
A note on monitoring ratios of two Weibull percentiles
P. Erto
2013
View Paper
A non parametric CUSUM control chart based on the Mann–Whitney statistic
Dabuxilatu Wang, L. Zhang, Q. Xiong
2013
View Paper
Using p values to design statistical process control charts
Zhonghua Li, P. Qiu, Snigdhansu Chatterjee, Zhaojun Wang
2013
View Paper
Enhancing the performance of CUSUM scale chart
S. Abbasi, M. Riaz, Arden Miller
2012
View Paper
Using p values to design statistical process control charts
Zhonghua Li, P. Qiu, Snigdhansu Chatterjee, Zhaojun Wang
2012
View Paper
Two simple Shewhart-type multivariate nonparametric control charts
J. Boone, S. Chakraborti
2012
View Paper
Guaranteed Conditional Performance of Control Charts via Bootstrap Methods
A. Gandy, J. Kvaløy
2011
View Paper
On Nonparametric Statistical Process Control of Univariate Processes
P. Qiu, Zhonghua Li
2011
View Paper
Enhancing the performance of EWMA charts
Nasir Abbas, Muhammad Riaz, Ronald J. M. M. Does
2011
View Paper
A Distribution-Free Control Chart for Retrospective Location Analysis of Subgrouped Multivariate Data
R. Bell
2011
View Paper
Nonparametric (Distribution-Free) Quality Control Charts†
S. Chakraborti
2011
View Paper
Recent Advances on Univariate Distribution-Free Shewhart-Type Control Charts
M. Koutras, I. Triantafyllou
2020
View Paper
A Class of Distribution-Free Exponentially Weighted Moving Average Schemes for Joint Monitoring of Location and Scale Parameters
Zhi Song, A. Mukherjee, M. Marozzi, Jiujun Zhang
2020
View Paper
On Change-Point Analysis-Based Distribution-Free Control Charts with Phase I Applications
C. Parpoula, A. Karagrigoriou
2020
View Paper
BCEWMA: A New and Effective Biosurveillance System for Disease Outbreak Detection
Kai Yang, P. Qiu
2020
View Paper
Monitoring Change Points by a Sign Change Method
Bo Ru Lai, Hsiuying Wang
2020
View Paper
AJAS / SPAS ISSN 2316-0861 A note on Computation of Multivariate Control Limits: The Bootstrap Approach
O. Ikpotokin, I. U. Siloko, M. Ehiemua
2020
View Paper
Dynamic Sampling Versions of Popular SPC Charts for Big Data Analysis
Samuel Anyaso-Samuel
2019
View Paper
CUSUM Average Run Length : Conditional or Unconditional ?
F. Lombard
2019
View Paper
Sequential rank cumulative sum charts for location and scale
C. V. Zyl
2018
View Paper
Recent Research in Dynamic Screening System for Sequential Process Monitoring
P. Qiu, L. You
2018
View Paper
Statistical Process Control Charts as a Tool for Analyzing Big Data
P. Qiu
2017
View Paper
EWMA control charts in statistical process monitoring
I. Zwetsloot
2016
View Paper
MODELLING OF MOVING CENTERLINE EXPONENTIALLY WEIGHTED MOVING AVERAGE (MCEWMA) WITH BOOTSTRAP APPROACH: CASE STUDY ON SUKUK MUSYARAKAH OF RANTAU ABANG CAPITAL BERHAD, MALAYSIA
N. Hila, L. Safiih, K. N. Shazrahanim
2016
View Paper
Permutation Approach in Obtaining Control Limits and Interpretation of out of Control Signals in Multivariate Control Charts
O. Ikpotokin, C. Ishiekwene
2016
View Paper
Improved performance of MCUSUM control chart with autocorrelation
A. U. Farouk, I. Mohamad
2015
View Paper
The Use of Inequalities of Camp-Meidell Type in Nonparametric Statistical Process Monitoring
R. Göb, K. Lurz
2015
View Paper
Interactive comment on “ Instability and change detection in exponential families and generalized linear models , with a study of Atlantic tropical storms ” by Y . Lu and S .
Chatterjee, Y. Lu, S. Chatterjee
2014
View Paper
Cumulative Sum Algorithms Based on Nonparametric Kernel Density Estimators
Tatevik Ambartsoumian
2013
View Paper
Detecting changes in high frequency data streams, with applications
Gordon J. Ross
2013
View Paper
Memory-type control charts in statistical process control
N. Abbas
2012
View Paper
CONTRIBUTIONS TO MULTIVARIATE CONTROL CHARTING: STUDIES OF THE Z CHART AND FOUR NONPARAMETRIC CHARTS
J. Boone
2010
View Paper

Comments (0)

This website uses cookies to ensure you get the best experience. Learn more