Divergence vs. Decision P-values: A Distinction Worth Making in Theory and Keeping in Practice
Publication
Metrics
AI Quick Summary
This paper distinguishes two types of P-values: divergence P-values, which measure compatibility between data and a model, and decision P-values, which are used to make binary decisions based on a threshold. It argues that these should be clearly differentiated in practice, especially when the goal is to summarize evidence rather than to implement a decision rule.
Paper Preview
Abstract
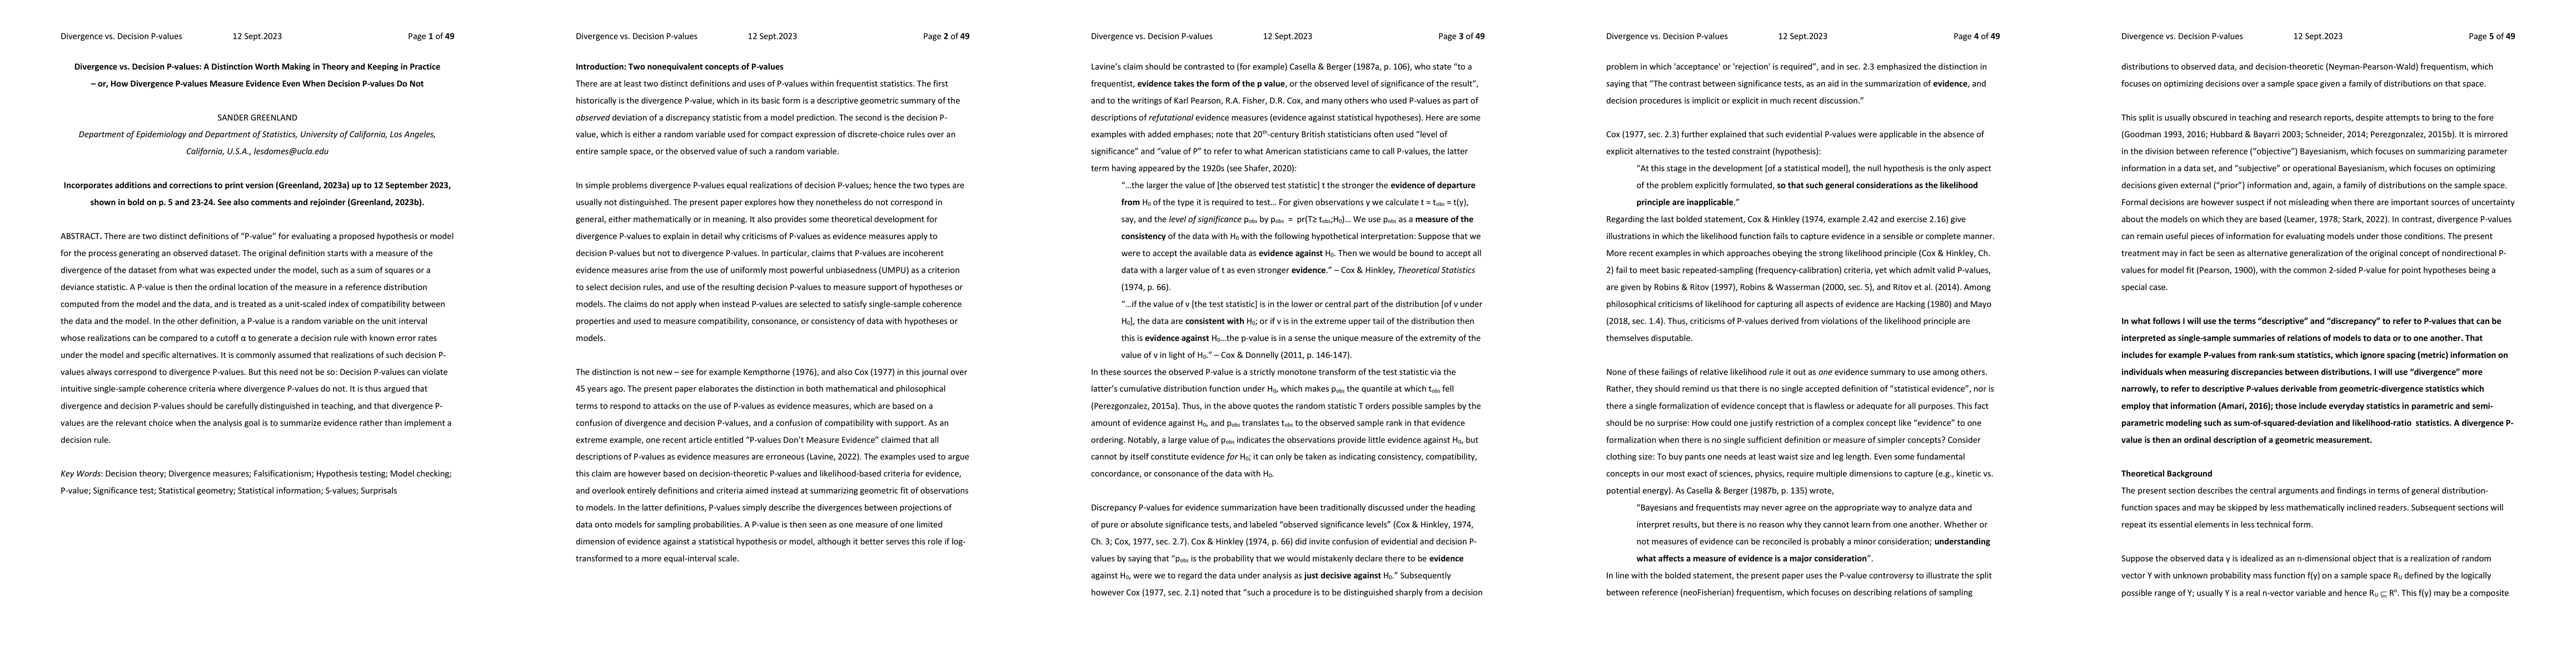
There are two distinct definitions of 'P-value' for evaluating a proposed hypothesis or model for the process generating an observed dataset. The original definition starts with a measure of the divergence of the dataset from what was expected under the model, such as a sum of squares or a deviance statistic. A P-value is then the ordinal location of the measure in a reference distribution computed from the model and the data, and is treated as a unit-scaled index of compatibility between the data and the model. In the other definition, a P-value is a random variable on the unit interval whose realizations can be compared to a cutoff alpha to generate a decision rule with known error rates under the model and specific alternatives. It is commonly assumed that realizations of such decision P-values always correspond to divergence P-values. But this need not be so: Decision P-values can violate intuitive single-sample coherence criteria where divergence P-values do not. It is thus argued that divergence and decision P-values should be carefully distinguished in teaching, and that divergence P-values are the relevant choice when the analysis goal is to summarize evidence rather than implement a decision rule.
AI Key Findings
Get AI-generated insights about this paper's methodology, results, significance, and more — seven facets brought into focus.
Impact
Paper Details
Authors
PDF Preview
Key Terms
Citation Network
Current paper (gray), citations (green), references (blue)
Display is limited for performance on very large graphs.
Discussion 0