Authors
Publication
Metrics
Quick Actions
AI Quick Summary
This paper introduces a new benchmark for understanding pedestrian behavior through intention estimation, action prediction, and event risk assessment, evaluating state-of-the-art models against three new performance metrics. It reveals insights into the differences between these tasks and the significance of various data modalities, concluding with directions for future research.
Paper Preview
Abstract
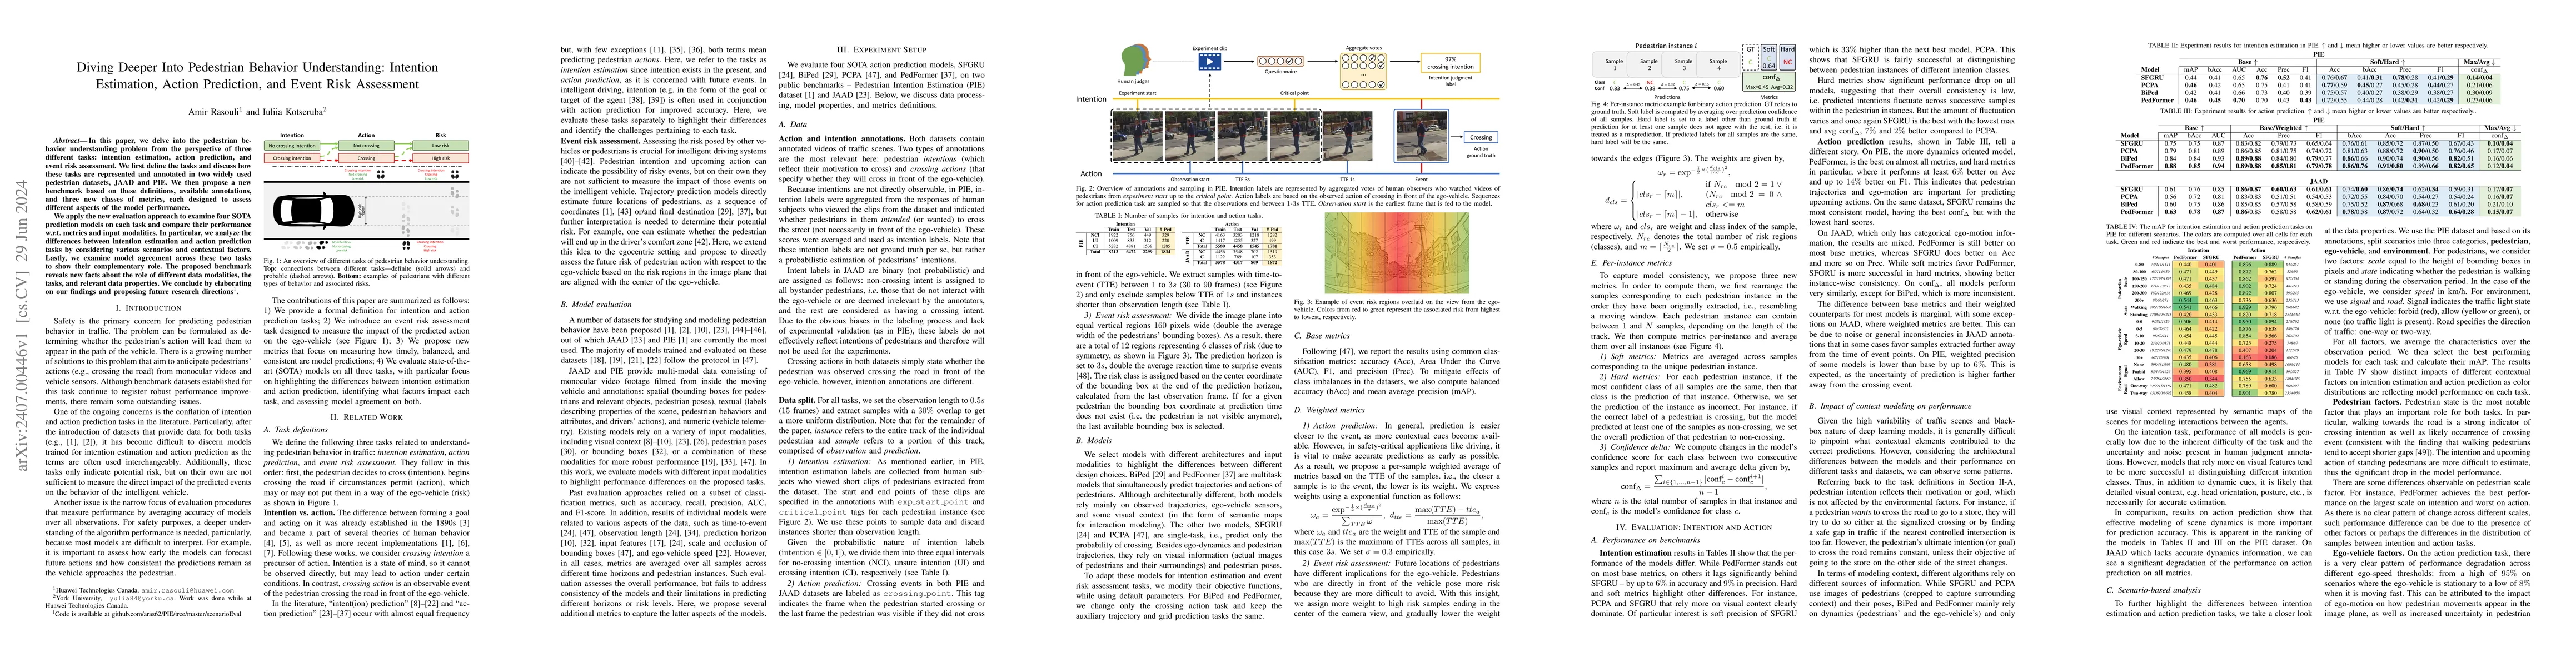
In this paper, we delve into the pedestrian behavior understanding problem from the perspective of three different tasks: intention estimation, action prediction, and event risk assessment. We first define the tasks and discuss how these tasks are represented and annotated in two widely used pedestrian datasets, JAAD and PIE. We then propose a new benchmark based on these definitions, available annotations, and three new classes of metrics, each designed to assess different aspects of the model performance. We apply the new evaluation approach to examine four SOTA prediction models on each task and compare their performance w.r.t. metrics and input modalities. In particular, we analyze the differences between intention estimation and action prediction tasks by considering various scenarios and contextual factors. Lastly, we examine model agreement across these two tasks to show their complementary role. The proposed benchmark reveals new facts about the role of different data modalities, the tasks, and relevant data properties. We conclude by elaborating on our findings and proposing future research directions.
AI Key Findings
Get AI-generated insights about this paper's methodology, results, and significance.
How to Cite This Paper
@article{rasouli2024diving,
  title         = {Diving Deeper Into Pedestrian Behavior Understanding: Intention
  Estimation, Action Prediction, and Event Risk Assessment},
  author        = {Rasouli, Amir and Kotseruba, Iuliia},
  year          = {2024},
  eprint        = {2407.00446},
  archivePrefix = {arXiv},
  primaryClass  = {cs.CV},
}Rasouli, A., & Kotseruba, I. (2024). Diving Deeper Into Pedestrian Behavior Understanding: Intention
Estimation, Action Prediction, and Event Risk Assessment. arXiv. https://arxiv.org/abs/2407.00446Rasouli, Amir, and Iuliia Kotseruba. "Diving Deeper Into Pedestrian Behavior Understanding: Intention
Estimation, Action Prediction, and Event Risk Assessment." arXiv, 2024, arxiv.org/abs/2407.00446.PDF Preview
Key Terms
Citation Network
Current paper (gray), citations (green), references (blue)
Display is limited for performance on very large graphs.
Similar Papers
Found 4 papersCoupling Intent and Action for Pedestrian Crossing Behavior Prediction
Ella Atkins, Xiaoxiao Du, Yu Yao et al.
No citations found for this paper.
Comments (0)