Publication
Metrics
AI Quick Summary
This paper proposes a "Topic Cloud" visualization to represent document semantics at a higher granularity by mapping documents to topic embeddings. The visualization uses a pie chart with slices for each topic, where slice size and word font size reflect topic and word importance, aiding in evaluating document representations and comparing different algorithms.
Paper Preview
Abstract
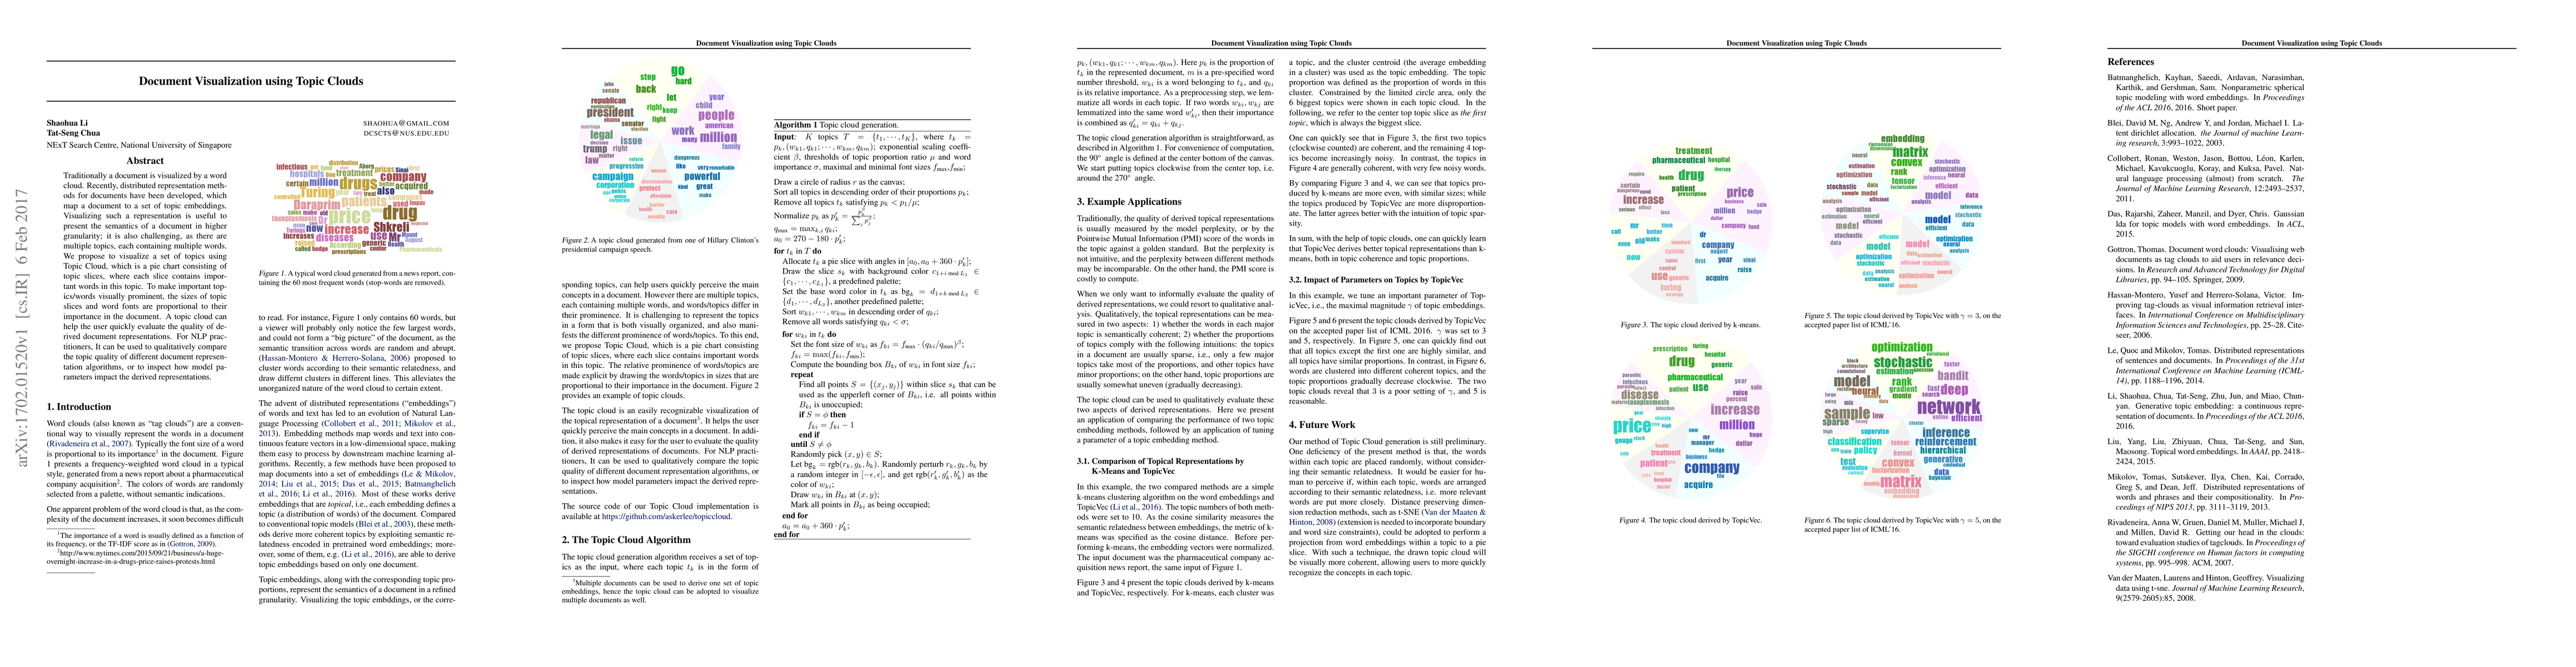
Traditionally a document is visualized by a word cloud. Recently, distributed representation methods for documents have been developed, which map a document to a set of topic embeddings. Visualizing such a representation is useful to present the semantics of a document in higher granularity; it is also challenging, as there are multiple topics, each containing multiple words. We propose to visualize a set of topics using Topic Cloud, which is a pie chart consisting of topic slices, where each slice contains important words in this topic. To make important topics/words visually prominent, the sizes of topic slices and word fonts are proportional to their importance in the document. A topic cloud can help the user quickly evaluate the quality of derived document representations. For NLP practitioners, It can be used to qualitatively compare the topic quality of different document representation algorithms, or to inspect how model parameters impact the derived representations.
AI Key Findings
Get AI-generated insights about this paper's methodology, results, significance, and more — seven facets brought into focus.
Impact
Paper Details
PDF Preview
Key Terms
Citation Network
Current paper (gray), citations (green), references (blue)
Display is limited for performance on very large graphs.
Discussion 0