Publication
Metrics
AI Quick Summary
The DESI 2024 study finds a $\sim 2 \sigma$ discrepancy in $\Omega_m$ from the Planck-$\Lambda$CDM model using Luminous Red Galaxy data at $z_{\textrm{eff}} = 0.51$, leading to an unexpectedly high $\Omega_m$ value. This anomaly also indicates a preference for $w_0 > -1$ in DESI data, suggesting that future data releases may reduce this discrepancy.
Paper Preview
Abstract
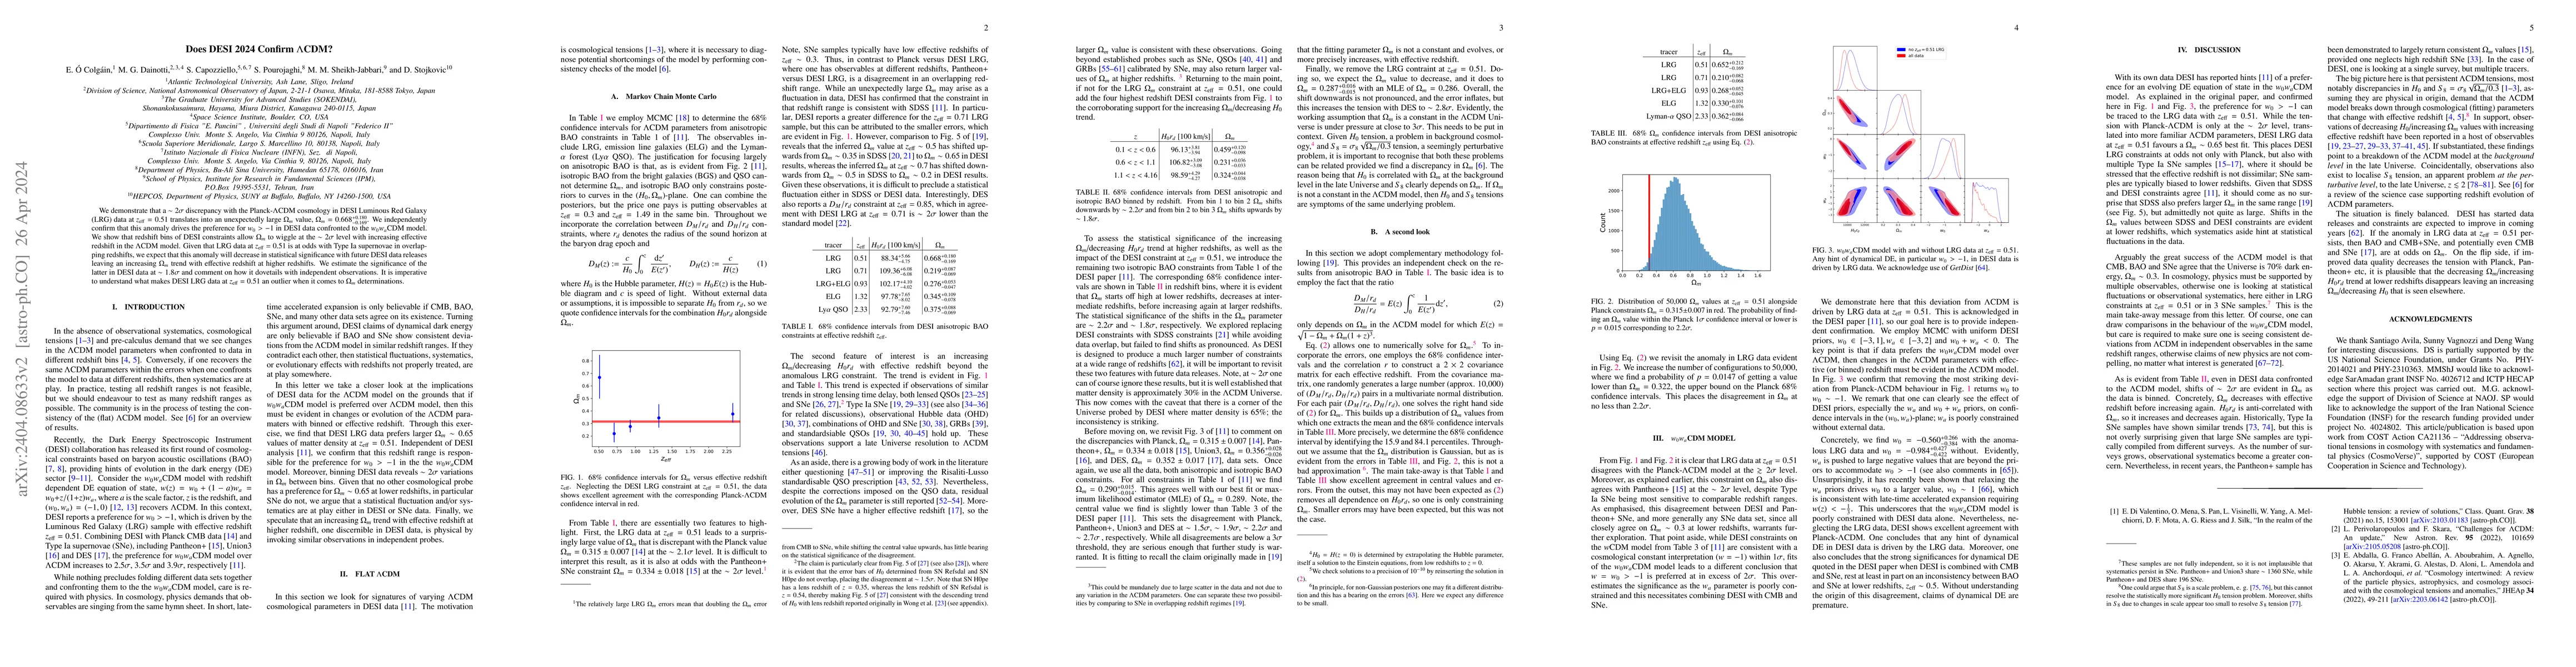
We demonstrate that a $\sim 2 \sigma$ discrepancy with the Planck-$\Lambda$CDM cosmology in DESI Luminous Red Galaxy (LRG) data at $z_{\textrm{eff}} = 0.51$ translates into an unexpectedly large $\Omega_m$ value, $\Omega_m = 0.668^{+0.180}_{-0.169}$. We independently confirm that this anomaly drives the preference for $w_0 > -1$ in DESI data confronted to the $w_0 w_a$CDM model. We show that redshift bins of DESI constraints allow $\Omega_m$ to wiggle at the $\sim 2 \sigma$ level with increasing effective redshift in the $\Lambda$CDM model. Given that LRG data at $z_{\textrm{eff}} = 0.51$ is at odds with Type Ia supernovae in overlapping redshifts, we expect that this anomaly will decrease in statistical significance with future DESI data releases leaving an increasing $\Omega_m$ trend with effective redshift at higher redshifts. We estimate the significance of the latter in DESI data at $\sim 1.8 \sigma$ and comment on how it dovetails with independent observations. It is imperative to understand what makes DESI LRG data at $z_{\textrm{eff}} = 0.51$ an outlier when it comes to $\Omega_m$ determinations.
AI Key Findings
Get AI-generated insights about this paper's methodology, results, significance, and more — seven facets brought into focus.
Impact
Paper Details
PDF Preview
Key Terms
Citation Network
Current paper (gray), citations (green), references (blue)
Display is limited for performance on very large graphs.
Discussion 0