This study investigates whether interactive visualizations enhance Bayesian reasoning compared to static ones. Results from two crowdsourced experiments indicate that interaction does not improve reasoning accuracy and can even detract from it in some cases, suggesting that well-designed static visualizations may be equally or more effective than interactive ones.
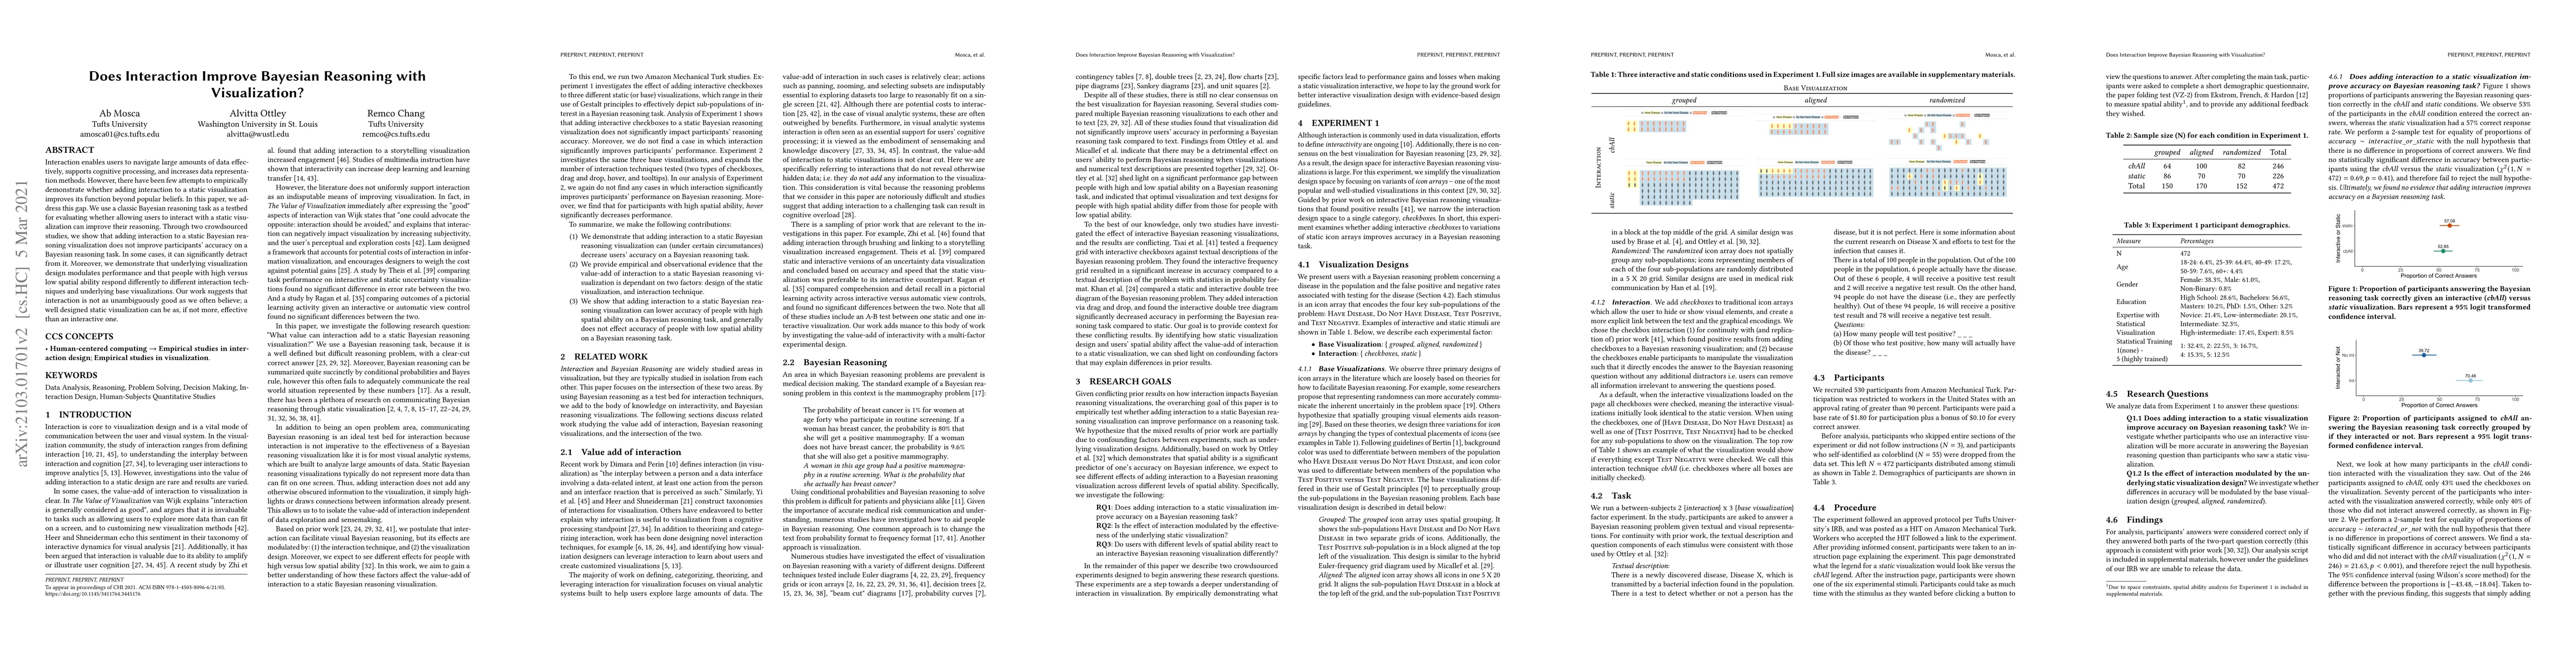
Interaction enables users to navigate large amounts of data effectively, supports cognitive processing, and increases data representation methods. However, there have been few attempts to empirically demonstrate whether adding interaction to a static visualization improves its function beyond popular beliefs. In this paper, we address this gap. We use a classic Bayesian reasoning task as a testbed for evaluating whether allowing users to interact with a static visualization can improve their reasoning. Through two crowdsourced studies, we show that adding interaction to a static Bayesian reasoning visualization does not improve participants' accuracy on a Bayesian reasoning task. In some cases, it can significantly detract from it. Moreover, we demonstrate that underlying visualization design modulates performance and that people with high versus low spatial ability respond differently to different interaction techniques and underlying base visualizations. Our work suggests that interaction is not as unambiguously good as we often believe; a well designed static visualization can be as, if not more, effective than an interactive one.
This graph shows how this paper is connected to other research. The current paper is shown in dark gray, papers that cite it are in green, and papers it references are in blue. You can:
• Hover over any node to see the paper title
• Click a node to view that paper's details
• Drag nodes to rearrange the graph
• Use the zoom controls (bottom right) to zoom in/out
Title | Authors | Year | Actions |
---|---|---|---|
The State of the Art in User‐Adaptive Visualizations
|
Fernando J. Yanez, Cristina Conati, Alvitta Ottley, Carolina Nobre
|
2024
|
View Paper |
Charting EDA: Characterizing Interactive Visualization Use in Computational Notebooks with a Mixed-Methods Formalism
|
Dylan Wootton, Amy Rae Fox, Evan Peck, Arvind Satyanarayan
|
2024
|
View Paper |
Impact of interaction technique in interactive data visualisations: A study on lookup, comparison, and relation-seeking tasks
|
N. V. Berkel, Benjamin Tag, R. Jacobsen, Daniel Russo, H. Purchase, Daniel Buschek
|
2024
|
View Paper |
Exploring Visualization for Fairness in AI Education
|
Xinyuan Yan, Youjia Zhou, Arul Mishra, Himanshu Mishra, Bei Wang
|
2024
|
View Paper |
Beyond English: Centering Multilingualism in Data Visualization
|
Noëlle Rakotondravony, Priya Dhawka, Melanie Bancilhon
|
2023
|
View Paper |
Do You Trust What You See? Toward A Multidimensional Measure of Trust in Visualization
|
Saugat Pandey, O. McKinley, R. Crouser, Alvitta Ottley
|
2023
|
View Paper |
Belief Decay or Persistence? A Mixed‐method Study on Belief Movement Over Time
|
Shrey Gupta, Alireza Karduni, Emily Wall
|
2023
|
View Paper |
Are interactive and tailored data visualizations effective in promoting flu vaccination among the elderly? Evidence from a randomized experiment
|
Lynne M. Cotter, Sijia Yang
|
2023
|
View Paper |
Mini‐VLAT: A Short and Effective Measure of Visualization Literacy
|
Saugat Pandey, Alvitta Ottley
|
2023
|
View Paper |
The Use of Visualizations to Improve Bayesian Reasoning: A Literature Review
|
Lucy Cui, Stephanie Lo, Zili Liu
|
2023
|
View Paper |
Communicating Intel to Decision-Makers: Toward the Integration Text and Charts in Reports
|
Melanie Bancilhon, R. Crouser, Alvitta Ottley
|
2023
|
View Paper |
Why Combining Text and Visualization Could Improve Bayesian Reasoning: A Cognitive Load Perspective
|
Melanie Bancilhon, AJ Wright, Sunwoo Ha, Jordan Crouser, Alvitta Ottley
|
2023
|
View Paper |
Does Interactive Conditioning Help Users Better Understand the Structure of Probabilistic Models?
|
Evdoxia Taka, Sebastian Stein, J. Williamson
|
2023
|
View Paper |
Supporting Bayesian Modeling With Visualizations
|
M. Dogucu, Alicia A. Johnson
|
2022
|
View Paper |
Designing Visualisations for Bayesian Problems According to Multimedia Principles
|
Theresa Büchter, Nicole Steib, Katharina Böcherer-Linder, Andreas Eichler, S. Krauss, Karin Binder, M. Vogel
|
2022
|
View Paper |
Editorial: Communication of Risk in the Public Realm
|
Manuele Reani, C. Jay, Alvitta Ottley
|
2022
|
View Paper |
Does Interacting Help Users Better Understand the Structure of Probabilistic Models?
|
Evdoxia Taka, Sebastian Stein, John H. Williamson School of Computing Science, U. Glasgow, Scotland, United Kingdom.
|
2022
|
View Paper |
Data Visualization Practitioners’ Perspectives on Chartjunk
|
Paul C. Parsons, P. Shukla
|
2020
|
View Paper |
Visualization Guidelines for Model Performance Communication Between Data Scientists and Subject Matter Experts
|
Ashley Suh, G. Appleby, Erik W. Anderson, Luca A. Finelli, Remco Chang, Dylan Cashman
|
2022
|
View Paper |
Does Interaction Help Users Better Understand the Structure of Probabilistic Models?
|
Evdoxia Taka, Sebastian Stein, J. Williamson
|
2022
|
View Paper |
Sunwoo Ha, Alvitta Ottley, Melanie Bancilhon, AJ Wright, Jordan Crouser
Published: 2023-02-03
Wei Zeng, Yuyu Luo, Jianing Hao, Zhuowen Liang, Chunting Li
Published: 2024-06-07
Comments (0)