Downscaling extremes: A comparison of extreme value distributions in point-source and gridded precipitation data
Publication
Metrics
AI Quick Summary
This paper compares extreme precipitation values derived from rain gauge data and gridded climate model outputs, finding that rain gauge data often show higher return values. It develops regression relationships to bridge these differences, suggesting future precipitation extremes can be projected at point locations based on climate models.
Paper Preview
Abstract
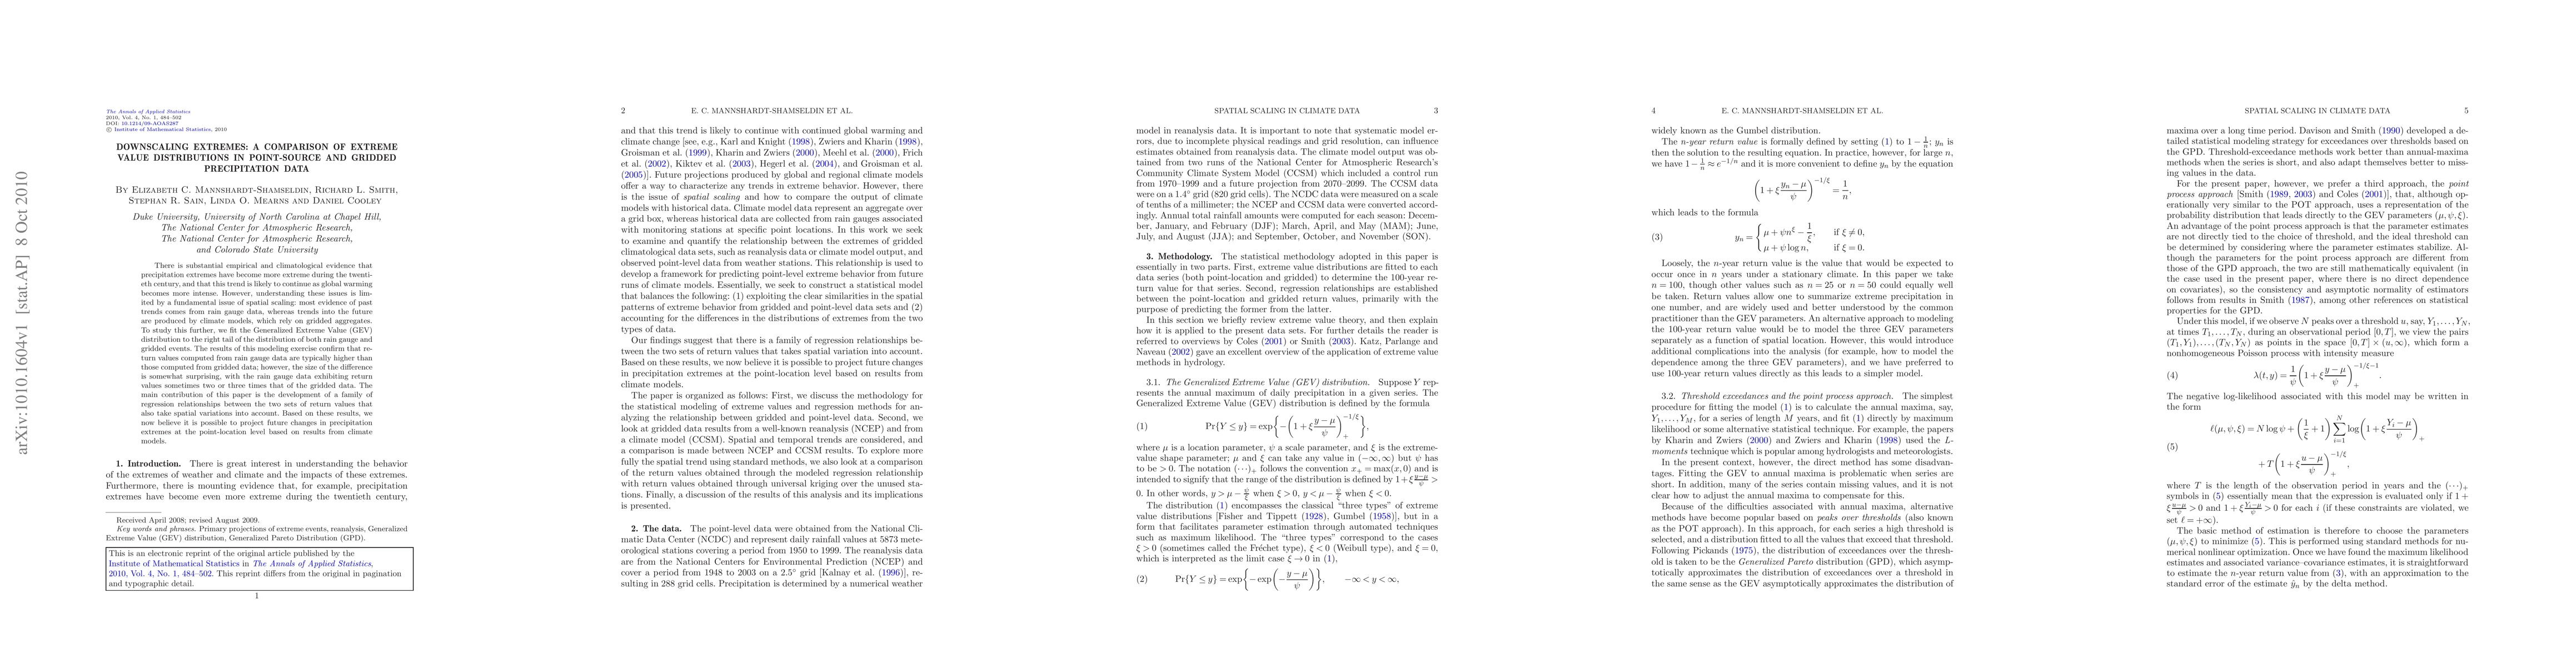
There is substantial empirical and climatological evidence that precipitation extremes have become more extreme during the twentieth century, and that this trend is likely to continue as global warming becomes more intense. However, understanding these issues is limited by a fundamental issue of spatial scaling: most evidence of past trends comes from rain gauge data, whereas trends into the future are produced by climate models, which rely on gridded aggregates. To study this further, we fit the Generalized Extreme Value (GEV) distribution to the right tail of the distribution of both rain gauge and gridded events. The results of this modeling exercise confirm that return values computed from rain gauge data are typically higher than those computed from gridded data; however, the size of the difference is somewhat surprising, with the rain gauge data exhibiting return values sometimes two or three times that of the gridded data. The main contribution of this paper is the development of a family of regression relationships between the two sets of return values that also take spatial variations into account. Based on these results, we now believe it is possible to project future changes in precipitation extremes at the point-location level based on results from climate models.
AI Key Findings
Get AI-generated insights about this paper's methodology, results, significance, and more — seven facets brought into focus.
Impact
Paper Details
PDF Preview
Key Terms
Citation Network
Current paper (gray), citations (green), references (blue)
Display is limited for performance on very large graphs.
Discussion 0