Drawing a better understanding of flood quantiles from a bag
Publication
Metrics
AI Quick Summary
This paper introduces an "animation bag of floods" to simplify the understanding of flood quantiles, emphasizing that flood hazard assessment should not focus solely on the "100-year flood" and should consider long-term probabilities and variability. The paper also presents Sample2Gumbel, a tool to visualize the distribution and variability of annual flood maxima, highlighting the importance of sample size in uncertainty estimation.
Paper Preview
Abstract
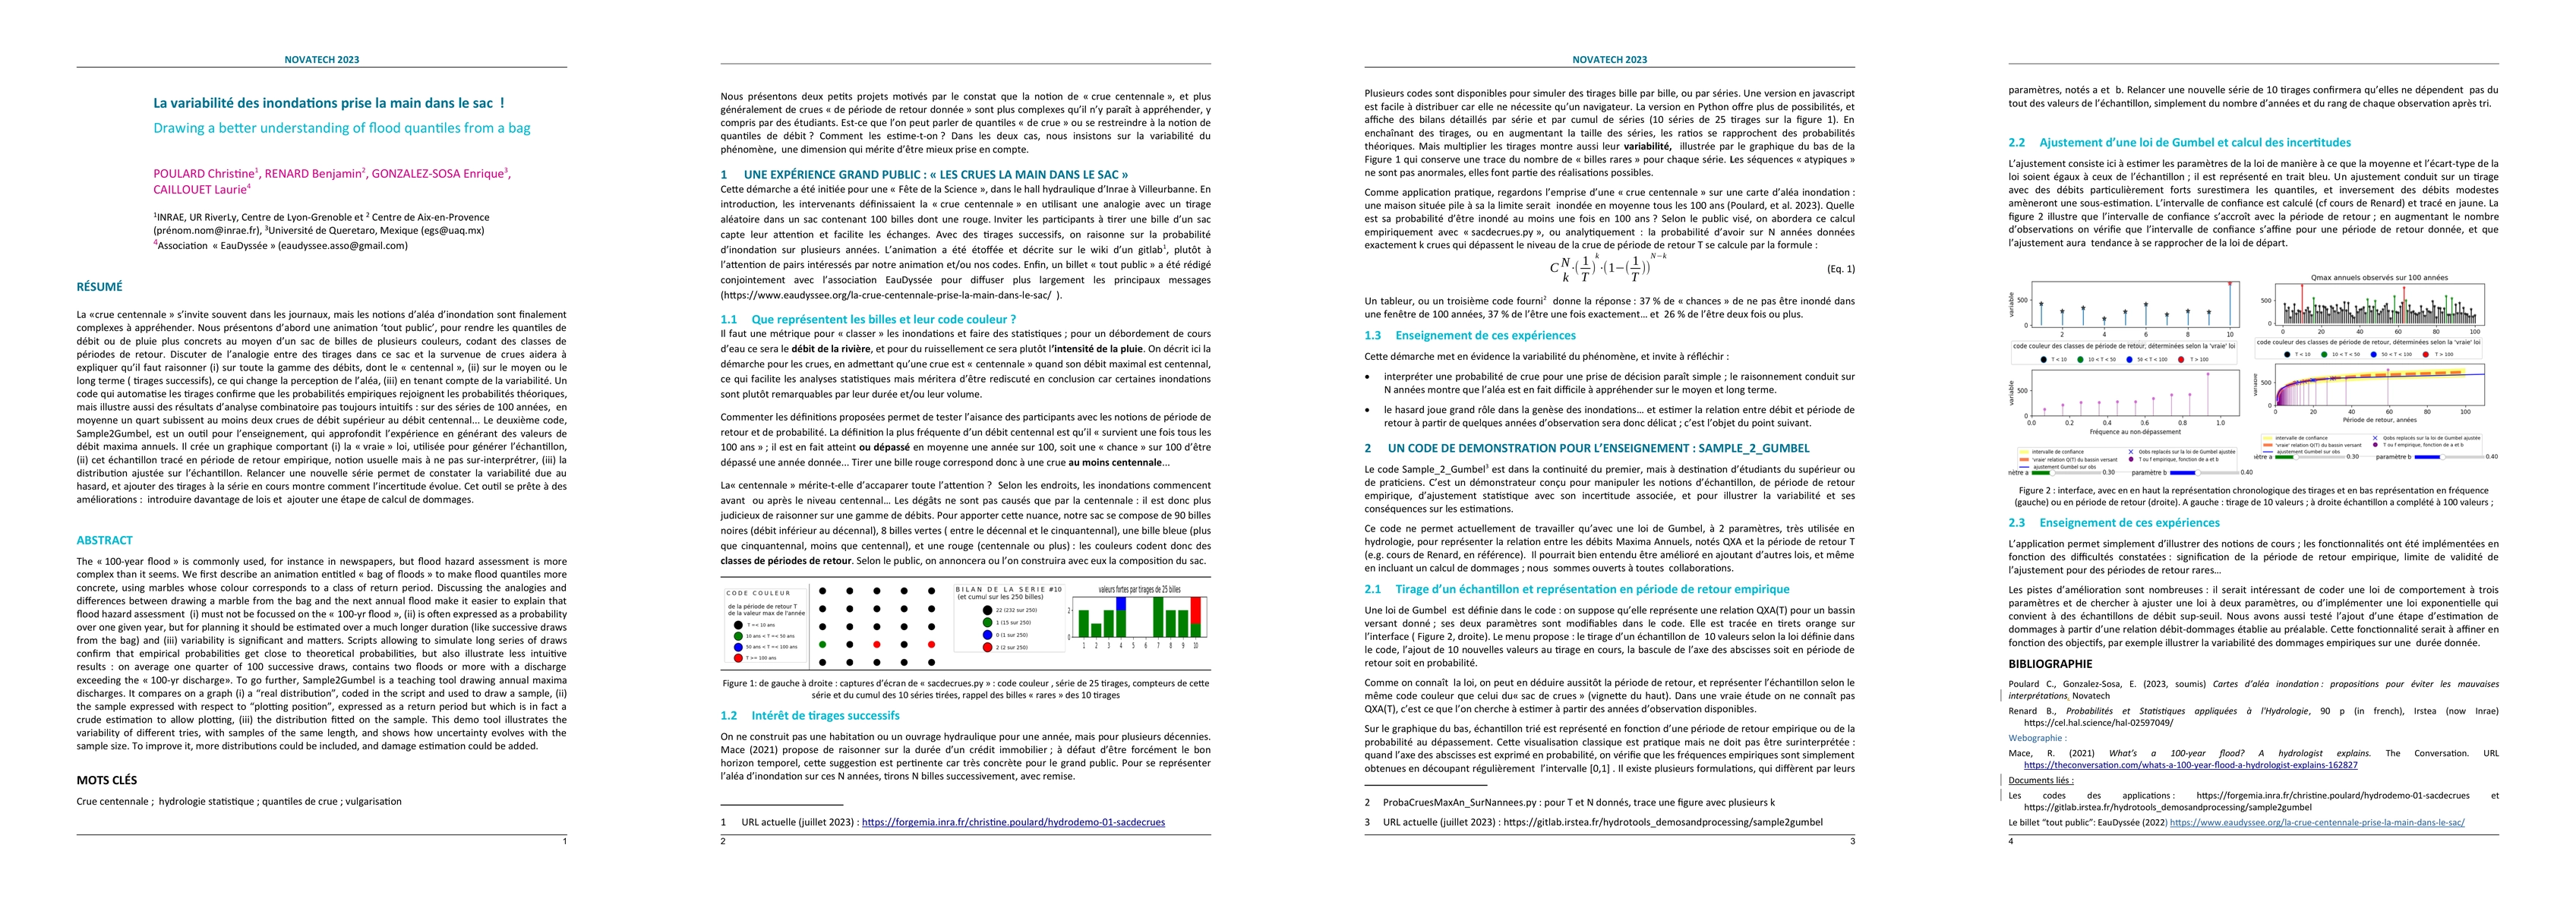
The "100-year flood" is commonly used, for instance in newspapers, but flood hazard assessment is more complex than it seems. We first describe an animation entitled "bag of floods" to make flood quantiles more concrete, using marbles whose colour corresponds to a class of return period. Discussing the analogies and differences between drawing a marble from the bag and the next annual flood make it easier to explain that flood hazard assessment (i) must not be focussed on the "100-yr flood", (ii) is often expressed as a probability over one given year, but for planning it should be estimated over a much longer duration (like successive draws from the bag) and (iii) variability is significant and matters. Scripts allowing to simulate long series of draws confirm that empirical probabilities get close to theoretical probabilities, but also illustrate less intuitive results : on average one quarter of 100 successive draws, contains two floods or more with a discharge exceeding the "100-yr discharge". To go further, Sample2Gumbel is a teaching tool drawing annual maxima discharges. It compares on a graph (i) a "real distribution", coded in the script and used to draw a sample, (ii) the sample expressed with respect to "plotting position", expressed as a return period but which is in fact a crude estimation to allow plotting, (iii) the distribution fitted on the sample. This demo tool illustrates the variability of different tries, with samples of the same length, and shows how uncertainty evolves with the sample size. To improve it, more distributions could be included, and damage estimation could be added.
AI Key Findings
Get AI-generated insights about this paper's methodology, results, significance, and more — seven facets brought into focus.
Paper Details
Authors
PDF Preview
Key Terms
Related Papers
No references found for this paper.
Discussion 0