Drawing a Map of Elections

PDF

Publication

Published: Apr 04, 2025
Updated: Apr 08, 2025
Categories: cs.MA, cs.AI, cs.GT

Metrics

Source: ArXiv

Quick Actions

View PDF

AI Quick Summary

This paper introduces a framework for creating maps of elections, where similar elections are represented as points in a 2D space, using a polynomial-time computable distance measure. The study focuses on synthetic and real-life election datasets, providing insights into election analysis and algorithm evaluation.

Quick Answers

What is "Drawing a Map of Elections" about?

This paper introduces a framework for creating maps of elections, where similar elections are represented as points in a 2D space, using a polynomial-time computable distance measure. The study focuses on synthetic and real-life election datasets, providing insights into election analysis and algorithm evaluation.

What methodology did the authors use?

The paper introduces the 'map of elections' framework, utilizing synthetic and real-life election datasets. It measures election similarities via a proposed polynomial-time computable positionwise distance due to the infeasibility of isomorphic swap distance. The representation in 2D Euclidean space is primarily achieved through the Kamada-Kawai algorithm, with two alternatives also demonstrated. Theoretical results support the framework, and experimental analysis validates... More in Methodology →

What are the key results?

Development of the 'map of elections' framework with synthetic and real-life datasets. — Proposal of a polynomial-time computable positionwise distance to measure election similarities. More in Key Results →

Why is this work significant?

This research contributes to the understanding of election patterns by visualizing and analyzing ordinal voting data, potentially aiding in the design and evaluation of voting systems and algorithms. More in Significance →

What are the main limitations?

Reliance on a proposed positionwise distance due to the infeasibility of isomorphic swap distance. — Limited to datasets of elections with ordinal votes. More in Limitations →

Paper Preview

Abstract

Our main contribution is the introduction of the map of elections framework. A map of elections consists of three main elements: (1) a dataset of elections (i.e., collections of ordinal votes over given sets of candidates), (2) a way of measuring similarities between these elections, and (3) a representation of the elections in the 2D Euclidean space as points, so that the more similar two elections are, the closer are their points. In our maps, we mostly focus on datasets of synthetic elections, but we also show an example of a map over real-life ones. To measure similarities, we would have preferred to use, e.g., the isomorphic swap distance, but this is infeasible due to its high computational complexity. Hence, we propose polynomial-time computable positionwise distance and use it instead. Regarding the representations in 2D Euclidean space, we mostly use the Kamada-Kawai algorithm, but we also show two alternatives. We develop the necessary theoretical results to form our maps and argue experimentally that they are accurate and credible. Further, we show how coloring the elections in a map according to various criteria helps in analyzing results of a number of experiments. In particular, we show colorings according to the scores of winning candidates or committees, running times of ILP-based winner determination algorithms, and approximation ratios achieved by particular algorithms.
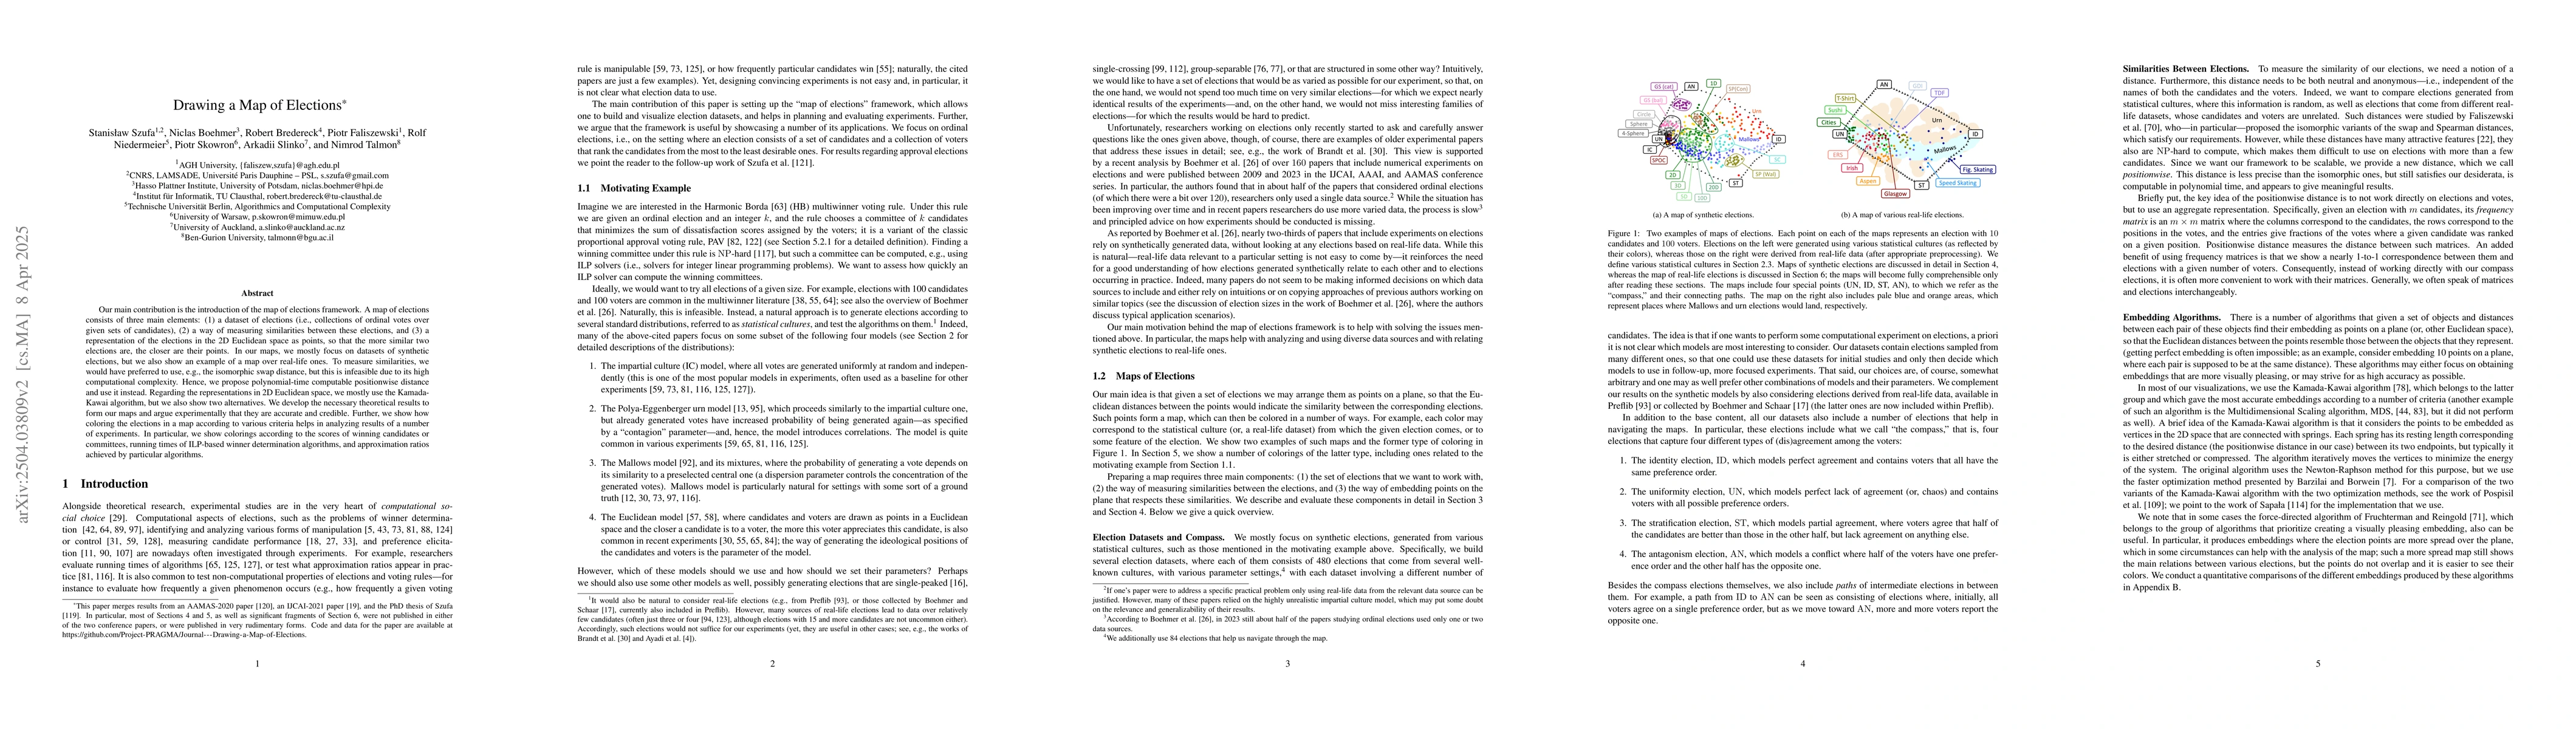
AI Key Findings

Generated Jun 10, 2025

Methodology — What approach did the authors take?

The paper introduces the 'map of elections' framework, utilizing synthetic and real-life election datasets. It measures election similarities via a proposed polynomial-time computable positionwise distance due to the infeasibility of isomorphic swap distance. The representation in 2D Euclidean space is primarily achieved through the Kamada-Kawai algorithm, with two alternatives also demonstrated. Theoretical results support the framework, and experimental analysis validates its accuracy.

Key Results — What are the main findings?

  • Development of the 'map of elections' framework with synthetic and real-life datasets.
  • Proposal of a polynomial-time computable positionwise distance to measure election similarities.
  • Use of Kamada-Kawai algorithm for representing elections in 2D Euclidean space.
  • Experimental validation of the framework's accuracy and credibility.
  • Demonstration of coloring elections in maps according to various criteria for analysis.

Significance — Why does this research matter?

This research contributes to the understanding of election patterns by visualizing and analyzing ordinal voting data, potentially aiding in the design and evaluation of voting systems and algorithms.

Technical Contribution — What is the technical contribution?

The introduction of the 'map of elections' framework, including a polynomial-time computable positionwise distance for measuring election similarities and representation in 2D Euclidean space.

Novelty — What is new about this work?

The work presents a novel approach to visualizing election data by overcoming computational complexity issues with existing methods, enabling analysis through color-coded representations based on various criteria.

Limitations — What are the limitations of this study?

  • Reliance on a proposed positionwise distance due to the infeasibility of isomorphic swap distance.
  • Limited to datasets of elections with ordinal votes.
  • Theoretical results and experimental validation are based on synthetic and a single example of real-life election data.

Future Work — What did the authors propose for future work?

  • Exploration of additional real-life election datasets for broader validation.
  • Investigation of alternative distance measures or improvements to the proposed positionwise distance.
  • Application of the framework to diverse voting systems and algorithms.

Paper Details

Paper ID: 2504.03809
Comments: Journal article merging results from arxiv:2105.07815, arXiv:2407.11889 and Szufa et al., "Drawing a Map of Elections in the Space of Statistical Cultures", AAMAS '20
Categories:
cs.MA cs.AI cs.GT

How to Cite This Paper

BibTeX
@article{slinko2025drawing,
  title         = {Drawing a Map of Elections},
  author        = {Slinko, Arkadii and Boehmer, Niclas and Talmon, Nimrod and others},
  year          = {2025},
  eprint        = {2504.03809},
  archivePrefix = {arXiv},
  primaryClass  = {cs.MA},
  doi           = {10.1016/j.artint.2025.104332},
}
APA 7
Slinko, A., Boehmer, N., Talmon, N., Faliszewski, P., Skowron, P., Bredereck, R., Niedermeier, R., & Szufa, S. (2025). Drawing a Map of Elections. arXiv. https://doi.org/10.1016/j.artint.2025.104332
MLA 9
Slinko, Arkadii, et al. "Drawing a Map of Elections." arXiv, 2025, doi.org/10.1016/j.artint.2025.104332.

Citation Network

Current paper (gray), citations (green), references (blue)

Display is limited for performance on very large graphs.

Current Paper
Citations
References
Click to view

Similar Papers

Found 4 papers

Map of Elections

Stanisław Szufa

2024-07-16

Putting a Compass on the Map of Elections

Niclas Boehmer, Rolf Niedermeier, Piotr Faliszewski et al.

2021-05-18

No citations found for this paper.

Comments (0)

This website uses cookies to ensure you get the best experience. Learn more