Publication
Published:
Jan 24, 2023
Updated:
Jun 09, 2025
Categories:
math.GM
Metrics
Source:
ArXiv
AI Quick Summary
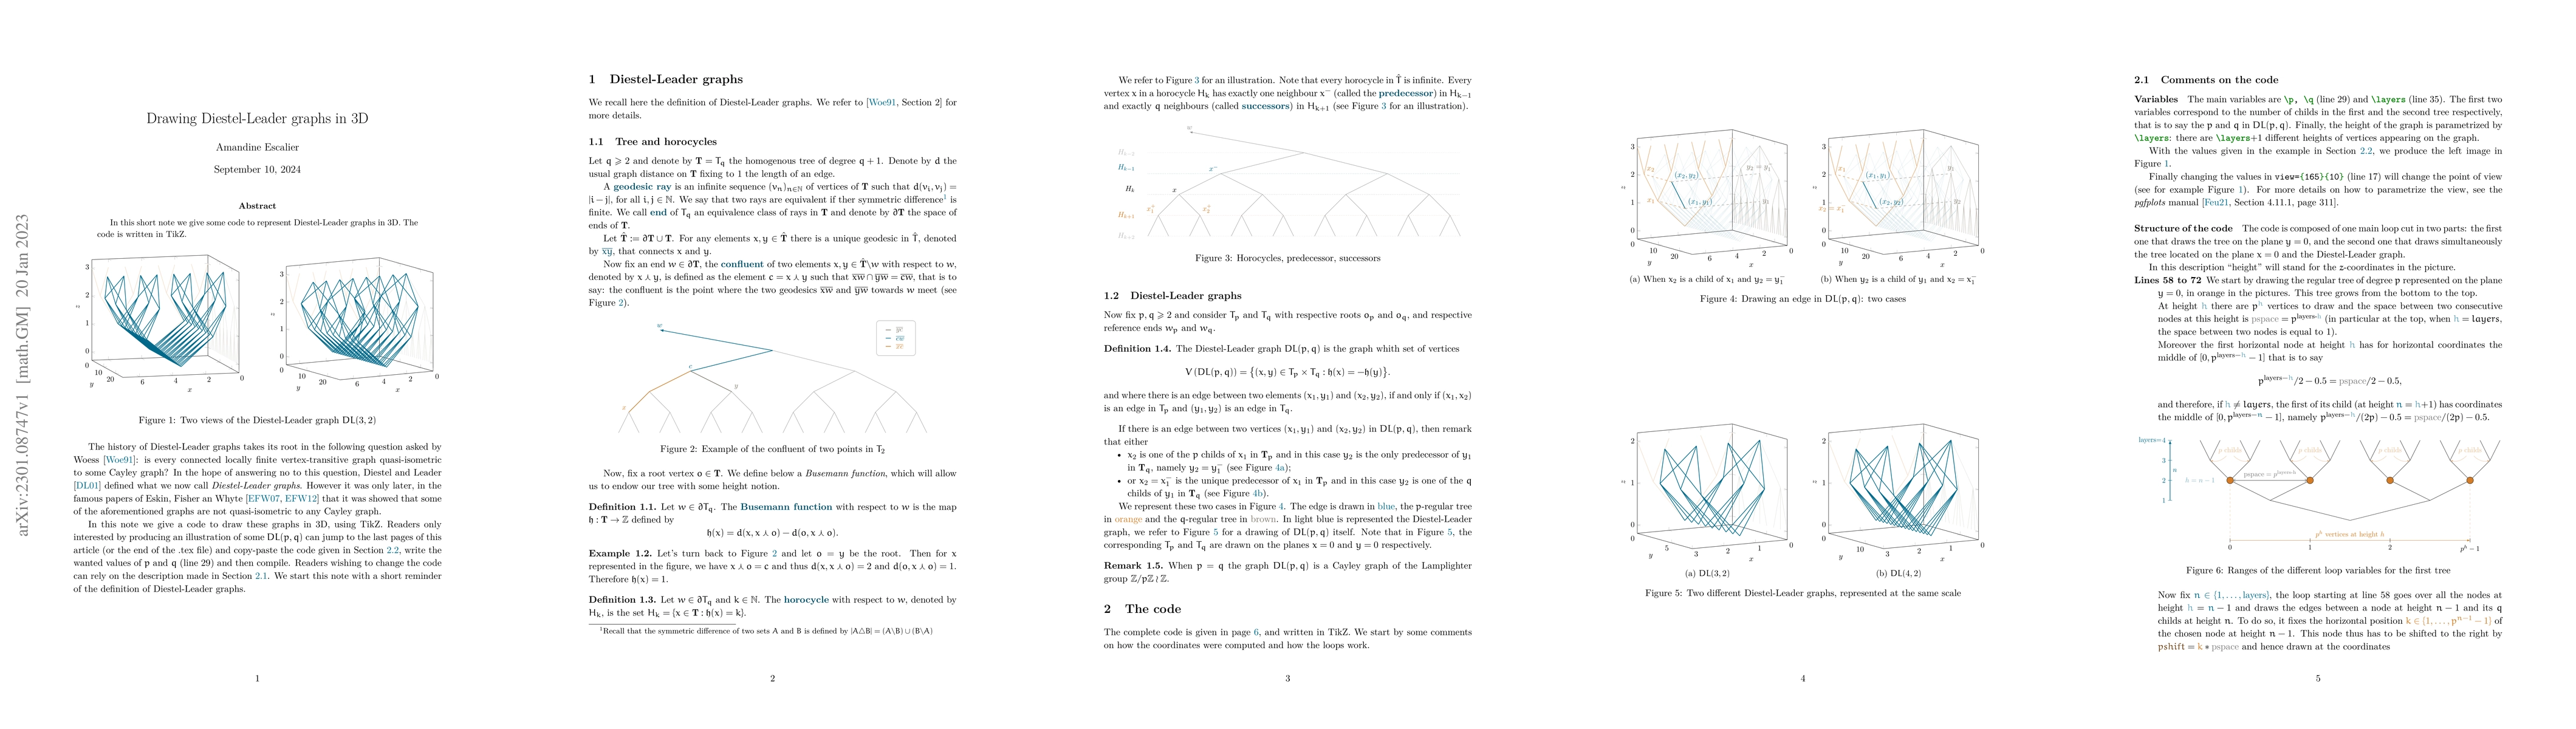
Summary: This paper presents a code in TikZ for rendering Diestel-Leader graphs in three-dimensional space, providing a visual representation of these mathematical structures. The code aims to facilitate the exploration and understanding of Diestel-Leader graphs through 3D visualization.
Paper Preview
Abstract
In this short note we give some code to represent Diestel-Leader graphs in 3D. The code is written in TikZ.
AI Key Findings
Get AI-generated insights about this paper's methodology, results, significance, and more — seven facets brought into focus.
Impact
5
References
Paper Details
Paper ID:
2301.08747
License:
http://creativecommons.org/licenses/by/4.0/
Comments:
10 pages, 9 figures, 3 pages of code
Categories:
math.GM
Authors
PDF Preview
Key Terms
code
(0.550)
written
(0.422)
note
(0.373)
represent
(0.372)
graphs
(0.358)
short
(0.336)
Citation Network
Current paper (gray), citations (green), references (blue)
Display is limited for performance on very large graphs.
Current Paper
Citations
References
Click to view
Discussion 0