DRL-STNet: Unsupervised Domain Adaptation for Cross-modality Medical Image Segmentation via Disentangled Representation Learning
Publication
Metrics
AI Quick Summary
DRL-STNet introduces a novel unsupervised domain adaptation framework for cross-modality medical image segmentation using GANs, disentangled representation learning, and self-training. It achieves superior segmentation performance on the FLARE challenge dataset, outperforming state-of-the-art methods significantly in Dice similarity and Normalized Surface Dice metrics.
Paper Preview
Abstract
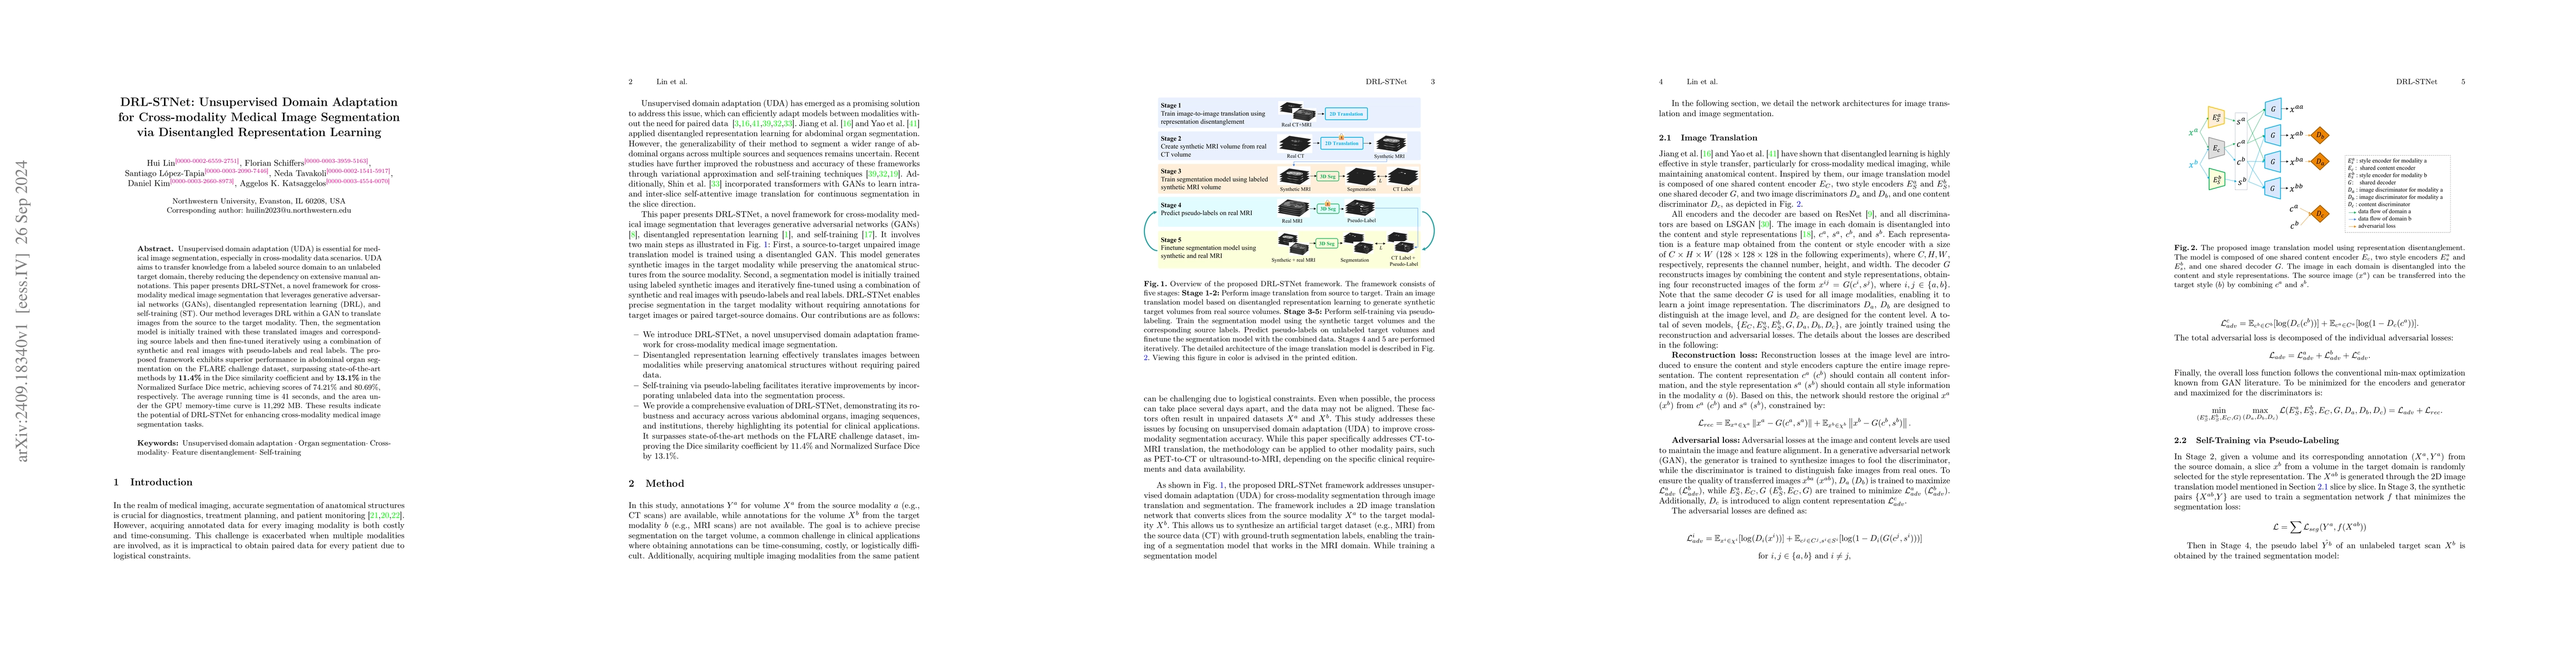
Unsupervised domain adaptation (UDA) is essential for medical image segmentation, especially in cross-modality data scenarios. UDA aims to transfer knowledge from a labeled source domain to an unlabeled target domain, thereby reducing the dependency on extensive manual annotations. This paper presents DRL-STNet, a novel framework for cross-modality medical image segmentation that leverages generative adversarial networks (GANs), disentangled representation learning (DRL), and self-training (ST). Our method leverages DRL within a GAN to translate images from the source to the target modality. Then, the segmentation model is initially trained with these translated images and corresponding source labels and then fine-tuned iteratively using a combination of synthetic and real images with pseudo-labels and real labels. The proposed framework exhibits superior performance in abdominal organ segmentation on the FLARE challenge dataset, surpassing state-of-the-art methods by 11.4% in the Dice similarity coefficient and by 13.1% in the Normalized Surface Dice metric, achieving scores of 74.21% and 80.69%, respectively. The average running time is 41 seconds, and the area under the GPU memory-time curve is 11,292 MB. These results indicate the potential of DRL-STNet for enhancing cross-modality medical image segmentation tasks.
AI Key Findings
Get AI-generated insights about this paper's methodology, results, significance, and more — seven facets brought into focus.
Impact
Paper Details
Authors
PDF Preview
Citation Network
Current paper (gray), citations (green), references (blue)
Display is limited for performance on very large graphs.
Discussion 0