Dual Space Coupling Model Guided Overlap-Free Scatterplot
Publication
Metrics
AI Quick Summary
This paper proposes a dual space coupling model to address the overdraw problem in scatterplots, ensuring an overlap-free visualization that maintains the original data distribution. The method integrates a geometry-based transformation, spatial exclusion algorithm, and visual encoding configuration to achieve accurate and efficient data representation.
Paper Preview
Abstract
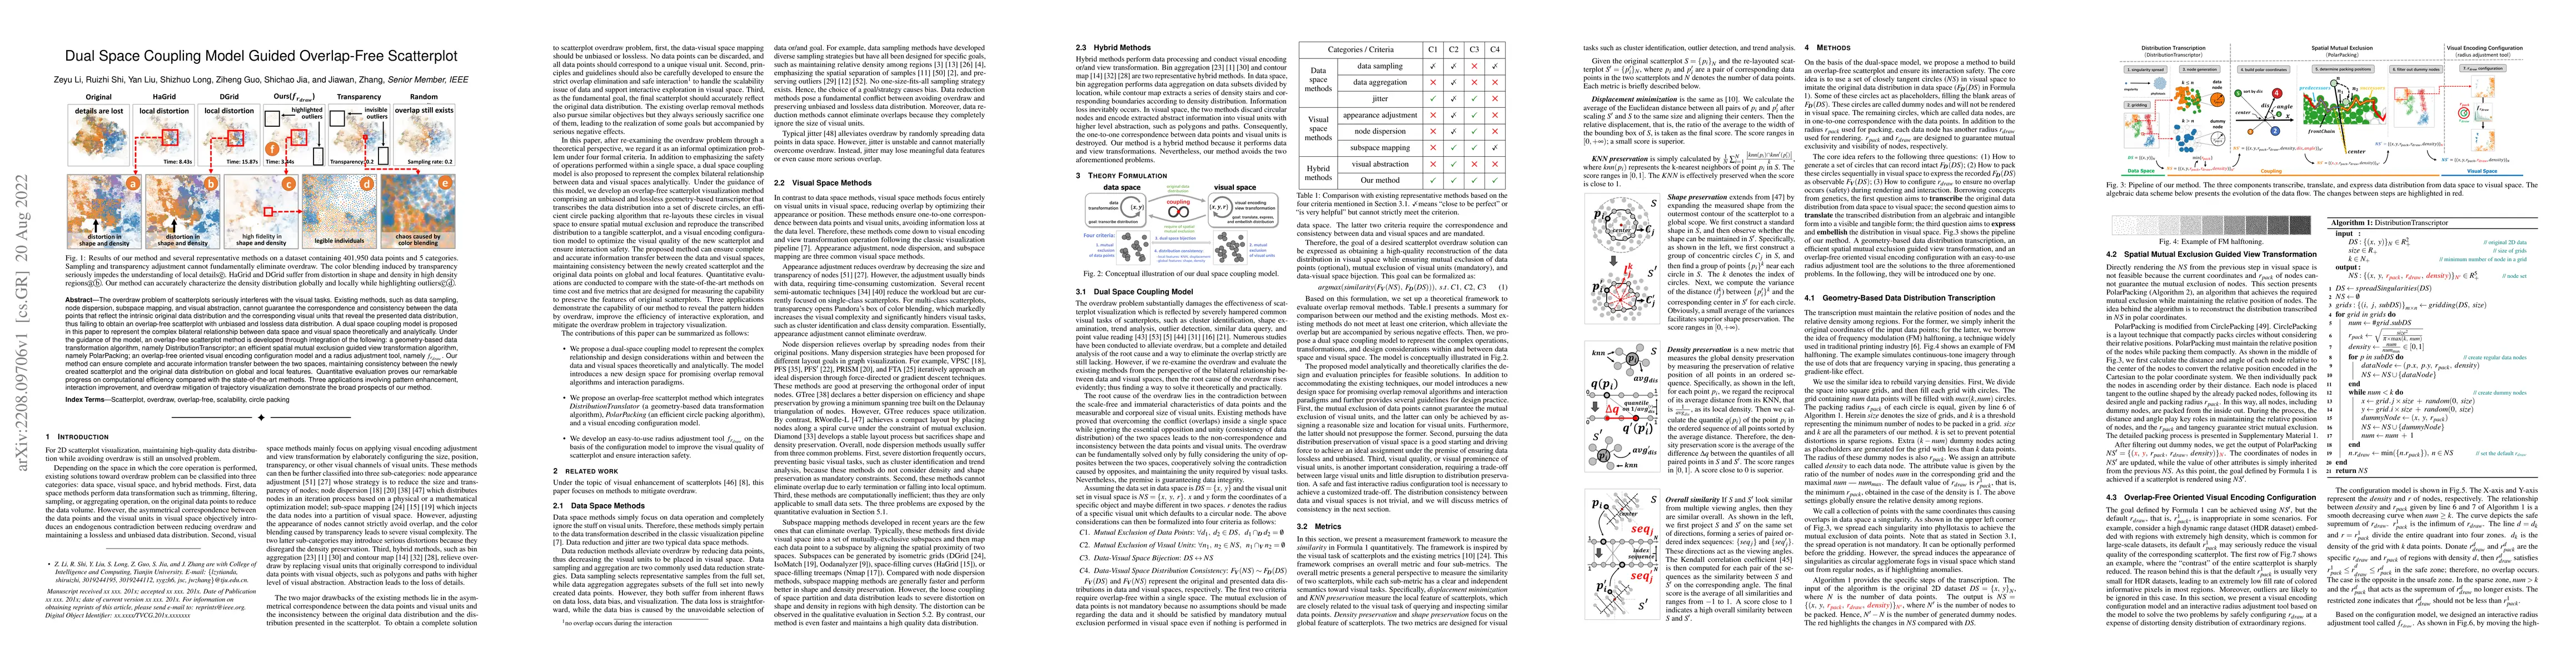
The overdraw problem of scatterplots seriously interferes with the visual tasks. Existing methods, such as data sampling, node dispersion, subspace mapping, and visual abstraction, cannot guarantee the correspondence and consistency between the data points that reflect the intrinsic original data distribution and the corresponding visual units that reveal the presented data distribution, thus failing to obtain an overlap-free scatterplot with unbiased and lossless data distribution. A dual space coupling model is proposed in this paper to represent the complex bilateral relationship between data space and visual space theoretically and analytically. Under the guidance of the model, an overlap-free scatterplot method is developed through integration of the following: a geometry-based data transformation algorithm, namely DistributionTranscriptor; an efficient spatial mutual exclusion guided view transformation algorithm, namely PolarPacking; an overlap-free oriented visual encoding configuration model and a radius adjustment tool, namely $f_{r_{draw}}$. Our method can ensure complete and accurate information transfer between the two spaces, maintaining consistency between the newly created scatterplot and the original data distribution on global and local features. Quantitative evaluation proves our remarkable progress on computational efficiency compared with the state-of-the-art methods. Three applications involving pattern enhancement, interaction improvement, and overdraw mitigation of trajectory visualization demonstrate the broad prospects of our method.
AI Key Findings
Get AI-generated insights about this paper's methodology, results, significance, and more — seven facets brought into focus.
Impact
Paper Details
Authors
PDF Preview
Key Terms
Citation Network
Current paper (gray), citations (green), references (blue)
Display is limited for performance on very large graphs.
Discussion 0