Dynamic Graph Representation with Knowledge-aware Attention for Histopathology Whole Slide Image Analysis
Publication
Metrics
AI Quick Summary
This paper introduces a dynamic graph representation method for histopathology whole slide image classification, employing knowledge-aware attention to capture interactions between instances, and achieves superior performance compared to existing methods on benchmark datasets.
Paper Preview
Abstract
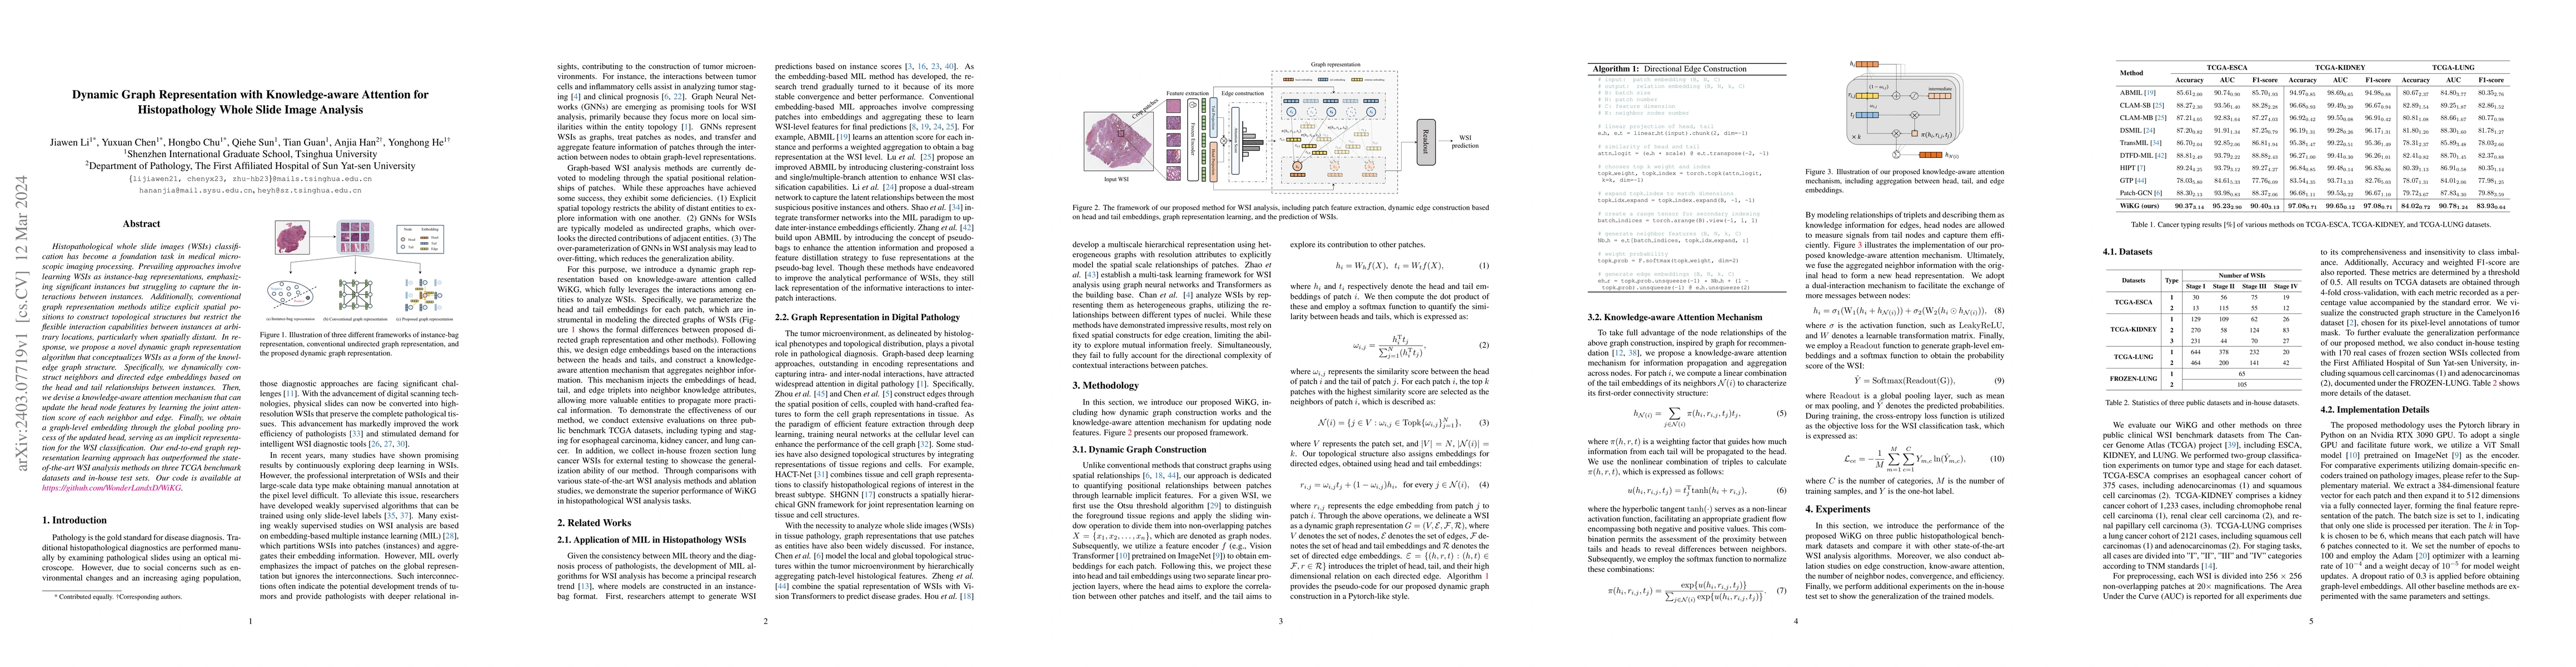
Histopathological whole slide images (WSIs) classification has become a foundation task in medical microscopic imaging processing. Prevailing approaches involve learning WSIs as instance-bag representations, emphasizing significant instances but struggling to capture the interactions between instances. Additionally, conventional graph representation methods utilize explicit spatial positions to construct topological structures but restrict the flexible interaction capabilities between instances at arbitrary locations, particularly when spatially distant. In response, we propose a novel dynamic graph representation algorithm that conceptualizes WSIs as a form of the knowledge graph structure. Specifically, we dynamically construct neighbors and directed edge embeddings based on the head and tail relationships between instances. Then, we devise a knowledge-aware attention mechanism that can update the head node features by learning the joint attention score of each neighbor and edge. Finally, we obtain a graph-level embedding through the global pooling process of the updated head, serving as an implicit representation for the WSI classification. Our end-to-end graph representation learning approach has outperformed the state-of-the-art WSI analysis methods on three TCGA benchmark datasets and in-house test sets. Our code is available at https://github.com/WonderLandxD/WiKG.
AI Key Findings
Get AI-generated insights about this paper's methodology, results, significance, and more — seven facets brought into focus.
Impact
Paper Details
Authors
PDF Preview
Key Terms
Citation Network
Current paper (gray), citations (green), references (blue)
Display is limited for performance on very large graphs.
Discussion 0