Publication
Metrics
AI Quick Summary
This paper proposes a novel Dynamic Mode Decomposition (DMD) method for analyzing nonlinear dynamical systems with dependent structures among observables, like graph sequences. The proposed method, Graph DMD, formulates Koopman spectral analysis in vector-valued reproducing kernel Hilbert spaces, enabling the extraction of low-dimensional global dynamics from such complex data. The performance of this method is validated using synthetic and real-world datasets.
Paper Preview
Abstract
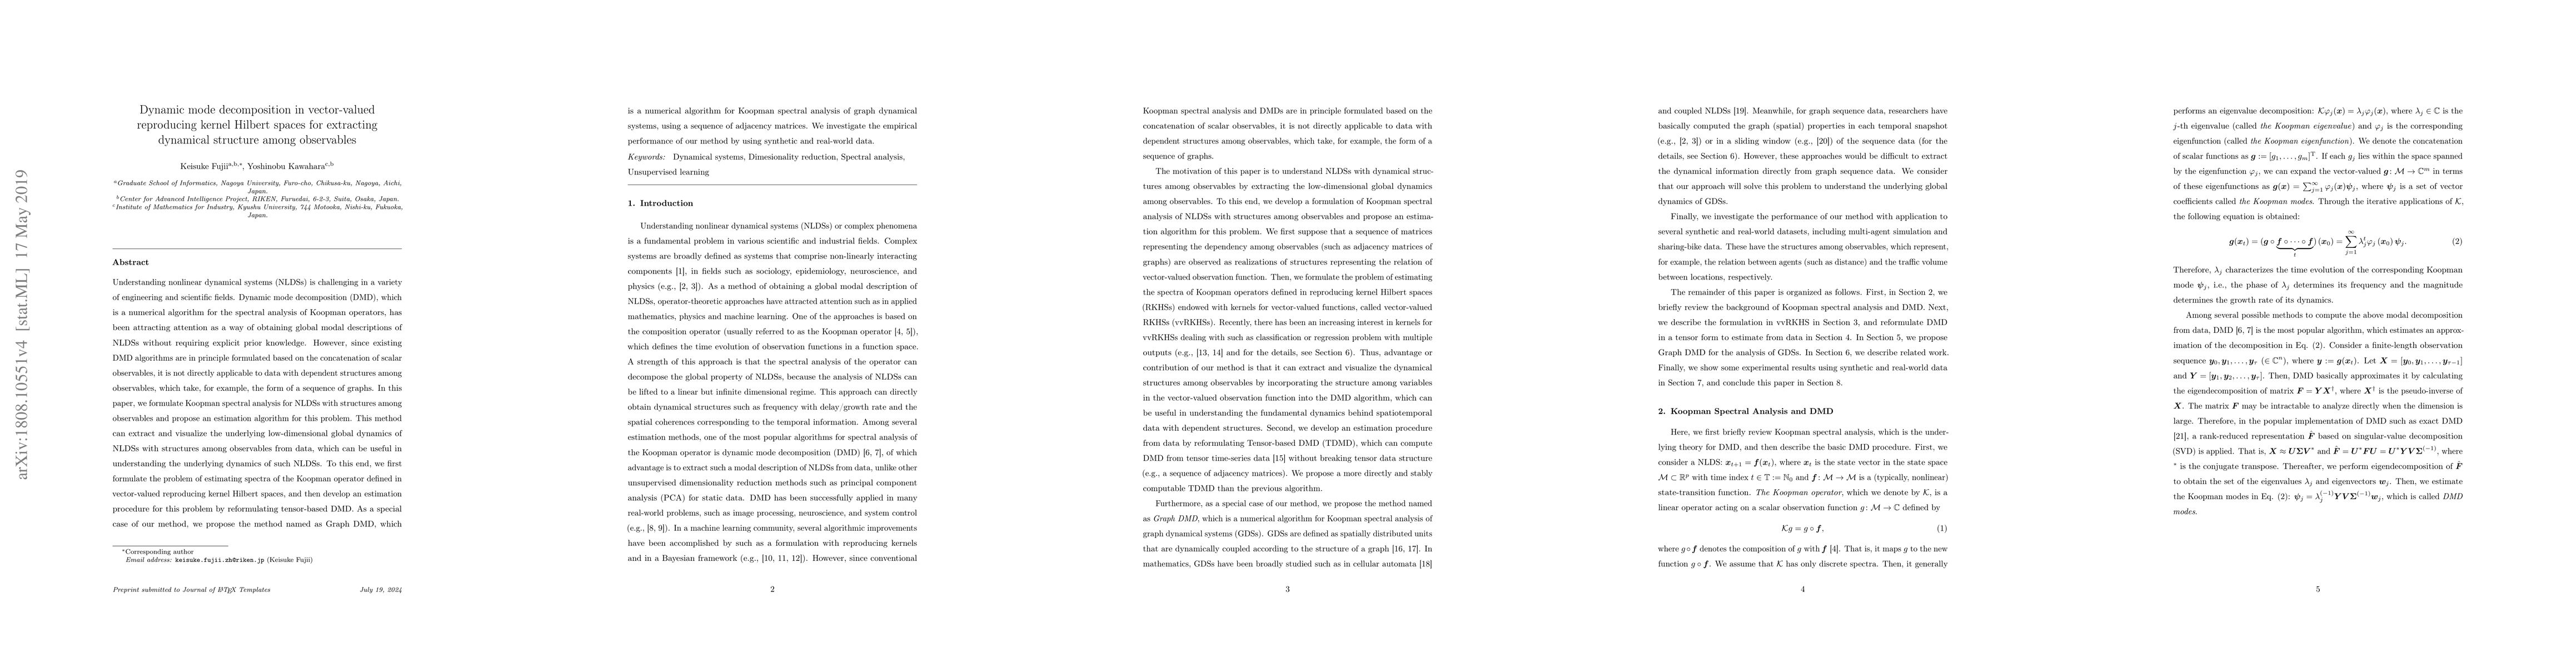
Understanding nonlinear dynamical systems (NLDSs) is challenging in a variety of engineering and scientific fields. Dynamic mode decomposition (DMD), which is a numerical algorithm for the spectral analysis of Koopman operators, has been attracting attention as a way of obtaining global modal descriptions of NLDSs without requiring explicit prior knowledge. However, since existing DMD algorithms are in principle formulated based on the concatenation of scalar observables, it is not directly applicable to data with dependent structures among observables, which take, for example, the form of a sequence of graphs. In this paper, we formulate Koopman spectral analysis for NLDSs with structures among observables and propose an estimation algorithm for this problem. This method can extract and visualize the underlying low-dimensional global dynamics of NLDSs with structures among observables from data, which can be useful in understanding the underlying dynamics of such NLDSs. To this end, we first formulate the problem of estimating spectra of the Koopman operator defined in vector-valued reproducing kernel Hilbert spaces, and then develop an estimation procedure for this problem by reformulating tensor-based DMD. As a special case of our method, we propose the method named as Graph DMD, which is a numerical algorithm for Koopman spectral analysis of graph dynamical systems, using a sequence of adjacency matrices. We investigate the empirical performance of our method by using synthetic and real-world data.
AI Key Findings
Get AI-generated insights about this paper's methodology, results, significance, and more — seven facets brought into focus.
Impact
Paper Details
Authors
PDF Preview
Key Terms
Citation Network
Current paper (gray), citations (green), references (blue)
Display is limited for performance on very large graphs.
Discussion 0