Publication
Metrics
Paper Preview
Abstract
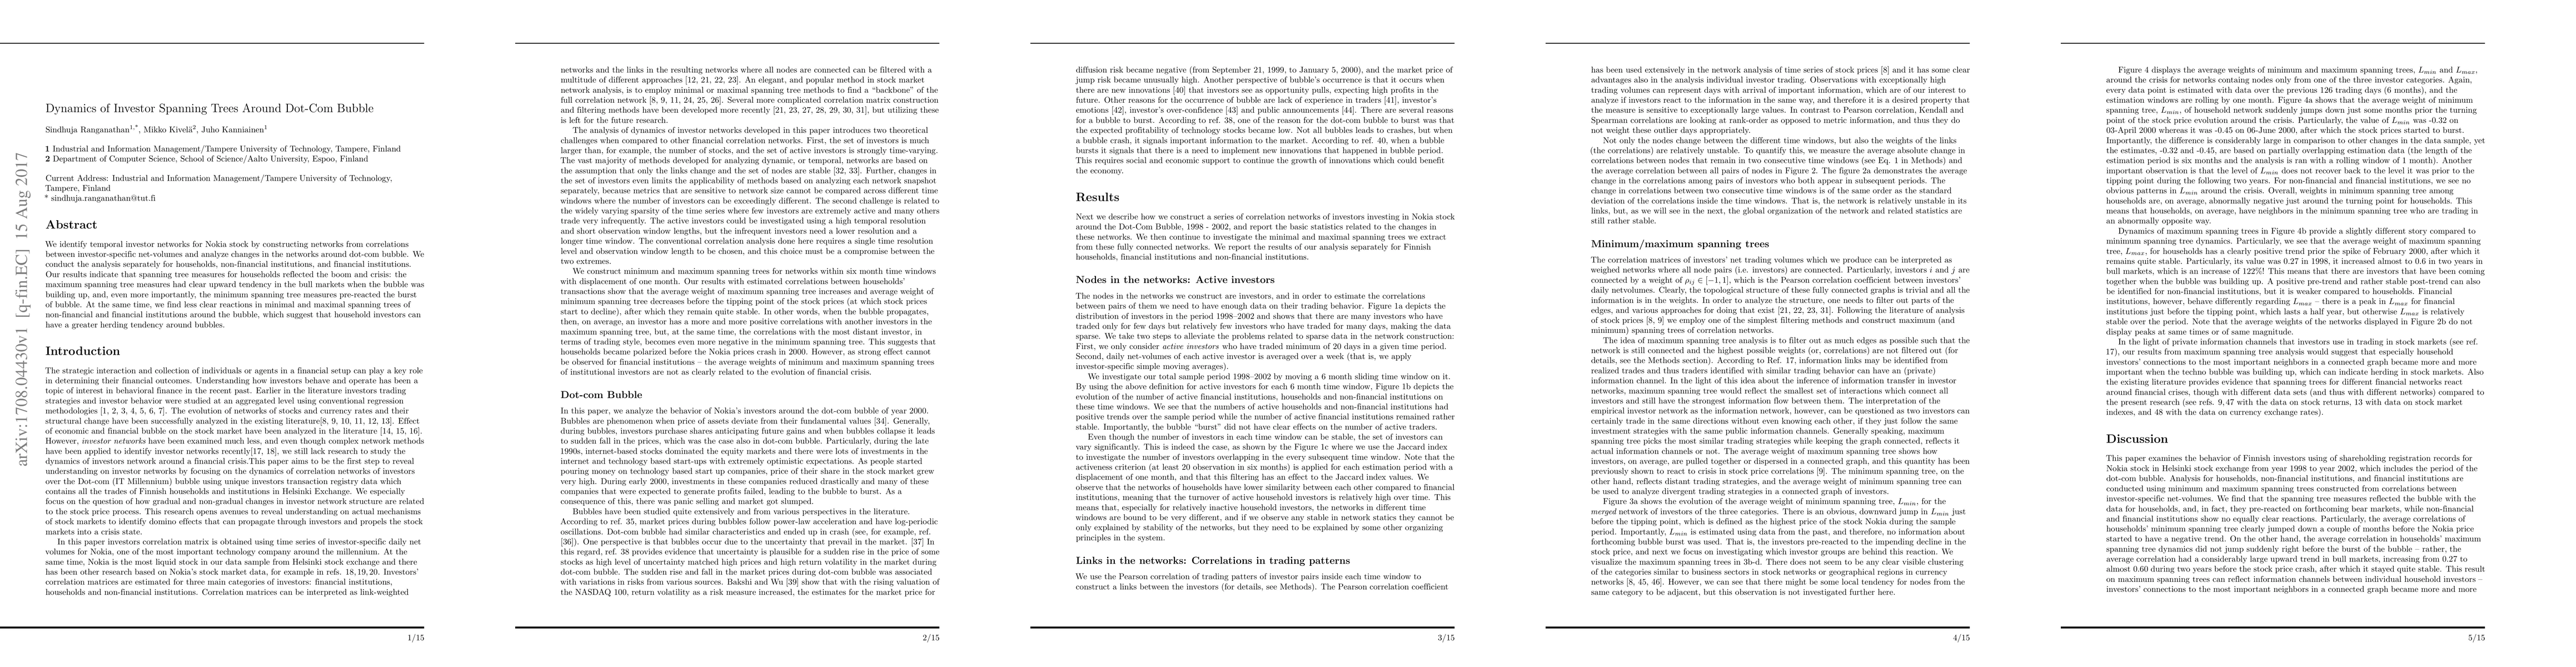
We identify temporal investor networks for Nokia stock by constructing networks from correlations between investor-specific net-volumes and analyze changes in the networks around dot-com bubble. We conduct the analysis separately for households, non-financial institutions, and financial institutions. Our results indicate that spanning tree measures for households reflected the boom and crisis: the maximum spanning tree measures had clear upward tendency in the bull markets when the bubble was building up, and, even more importantly, the minimum spanning tree measures pre-reacted the burst of bubble. At the same time, we find less clear reactions in minimal and maximal spanning trees of non-financial and financial institutions around the bubble, which suggest that household investors can have a greater herding tendency around bubbles.
AI Key Findings
Get AI-generated insights about this paper's methodology, results, significance, and more — seven facets brought into focus.
Impact
Paper Details
PDF Preview
Key Terms
Citation Network
Current paper (gray), citations (green), references (blue)
Display is limited for performance on very large graphs.
Discussion 0