Publication
Metrics
AI Quick Summary
This paper investigates the evolution of transcription factor binding sites (TFBS) using a biophysical model, finding that the rates of gain and loss of TFBS are typically slow unless strong selection pressures are present. It concludes that the evolution of longer TFBS is unlikely on typical speciation timescales, but factors like longer regulatory sequences and cooperative interactions can facilitate TFBS gain.
Paper Preview
Abstract
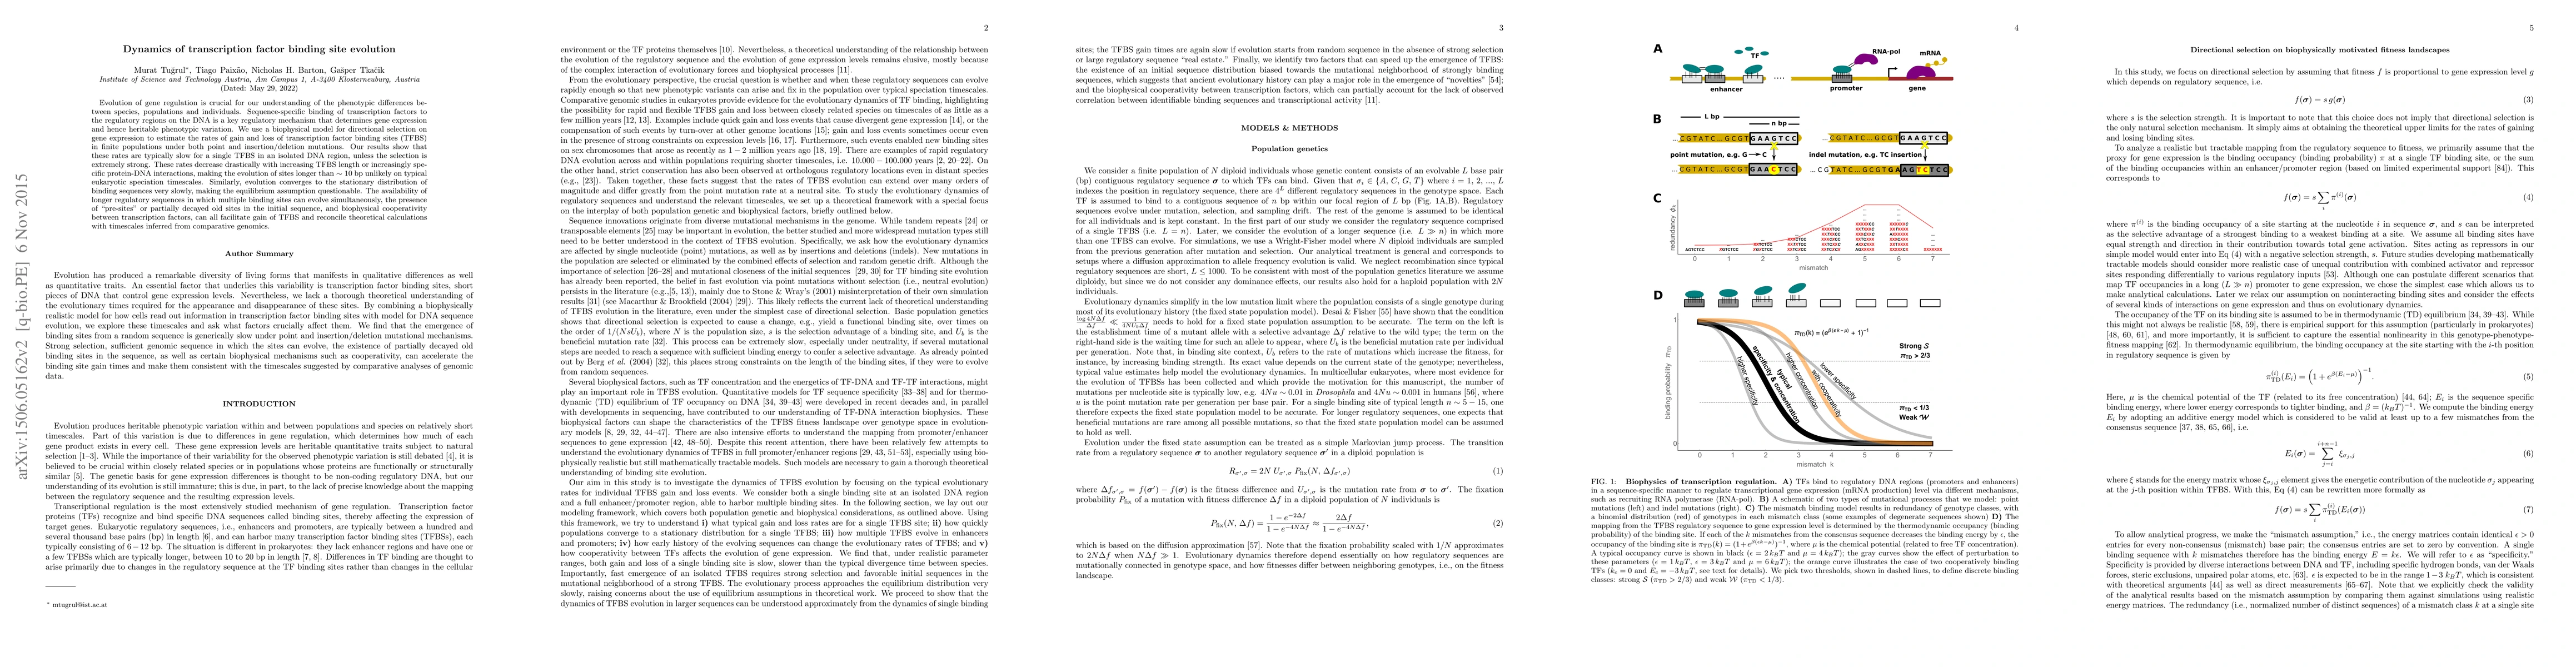
Evolution of gene regulation is crucial for our understanding of the phenotypic differences between species, populations and individuals. Sequence-specific binding of transcription factors to the regulatory regions on the DNA is a key regulatory mechanism that determines gene expression and hence heritable phenotypic variation. We use a biophysical model for directional selection on gene expression to estimate the rates of gain and loss of transcription factor binding sites (TFBS) in finite populations under both point and insertion/deletion mutations. Our results show that these rates are typically slow for a single TFBS in an isolated DNA region, unless the selection is extremely strong. These rates decrease drastically with increasing TFBS length or increasingly specific protein-DNA interactions, making the evolution of sites longer than ~10 bp unlikely on typical eukaryotic speciation timescales. Similarly, evolution converges to the stationary distribution of binding sequences very slowly, making the equilibrium assumption questionable. The availability of longer regulatory sequences in which multiple binding sites can evolve simultaneously, the presence of "pre-sites" or partially decayed old sites in the initial sequence, and biophysical cooperativity between transcription factors, can all facilitate gain of TFBS and reconcile theoretical calculations with timescales inferred from comparative genetics.
AI Key Findings — Failed
Key findings generation failed. Failed to start generation process
Impact
Paper Details
PDF Preview
Key Terms
Citation Network
Current paper (gray), citations (green), references (blue)
Display is limited for performance on very large graphs.
Discussion 0