Publication
Metrics
AI Quick Summary
The paper presents a novel deep learning framework for real-time detection of blazar variability across multiple wavelengths, employing unsupervised anomaly detection to identify flaring episodes without pre-labeled data, and demonstrating its effectiveness on historical and simulated blazar light curves. The method is robust to data quality issues and shows reliable flare detection.
Paper Preview
Abstract
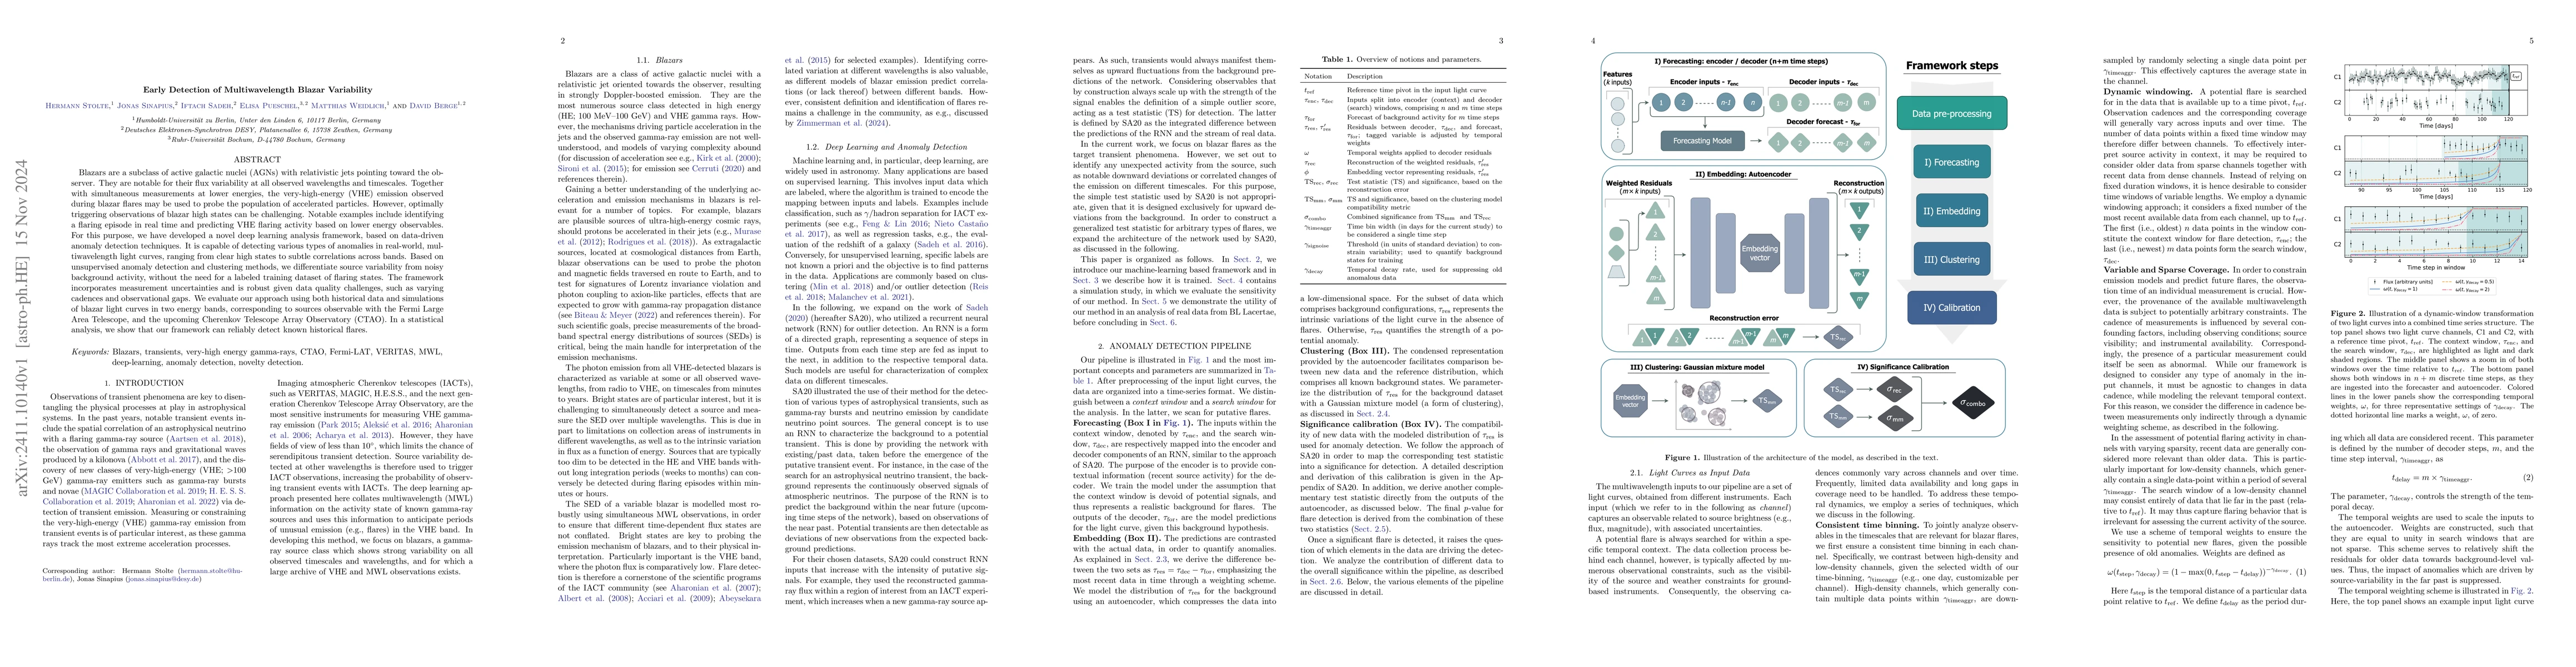
Blazars are a subclass of active galactic nuclei (AGNs) with relativistic jets pointing toward the observer. They are notable for their flux variability at all observed wavelengths and timescales. Together with simultaneous measurements at lower energies, the very-high-energy (VHE) emission observed during blazar flares may be used to probe the population of accelerated particles. However, optimally triggering observations of blazar high states can be challenging. Notable examples include identifying a flaring episode in real time and predicting VHE flaring activity based on lower energy observables. For this purpose, we have developed a novel deep learning analysis framework, based on data-driven anomaly detection techniques. It is capable of detecting various types of anomalies in real-world, multiwavelength light curves, ranging from clear high states to subtle correlations across bands. Based on unsupervised anomaly detection and clustering methods, we differentiate source variability from noisy background activity, without the need for a labeled training dataset of flaring states. The framework incorporates measurement uncertainties and is robust given data quality challenges, such as varying cadences and observational gaps. We evaluate our approach using both historical data and simulations of blazar light curves in two energy bands, corresponding to sources observable with the Fermi Large Area Telescope, and the upcoming Cherenkov Telescope Array Observatory (CTAO). In a statistical analysis, we show that our framework can reliably detect known historical flares.
AI Key Findings
Get AI-generated insights about this paper's methodology, results, significance, and more — seven facets brought into focus.
Impact
Authors
PDF Preview
Citation Network
Current paper (gray), citations (green), references (blue)
Display is limited for performance on very large graphs.
Discussion 0