Easy JavaScript Simulation (EJSS) Data Analytics for Singapore
Publication
Metrics
AI Quick Summary
This paper integrates Easy JavaScript Simulation (EJSS) Data Analytics into Singapore's national Learning Management System to enhance teaching and learning through data analytics. It highlights EJSS's ability to identify student learning difficulties and misconceptions, providing insights into student behavior and engagement.
Paper Preview
Abstract
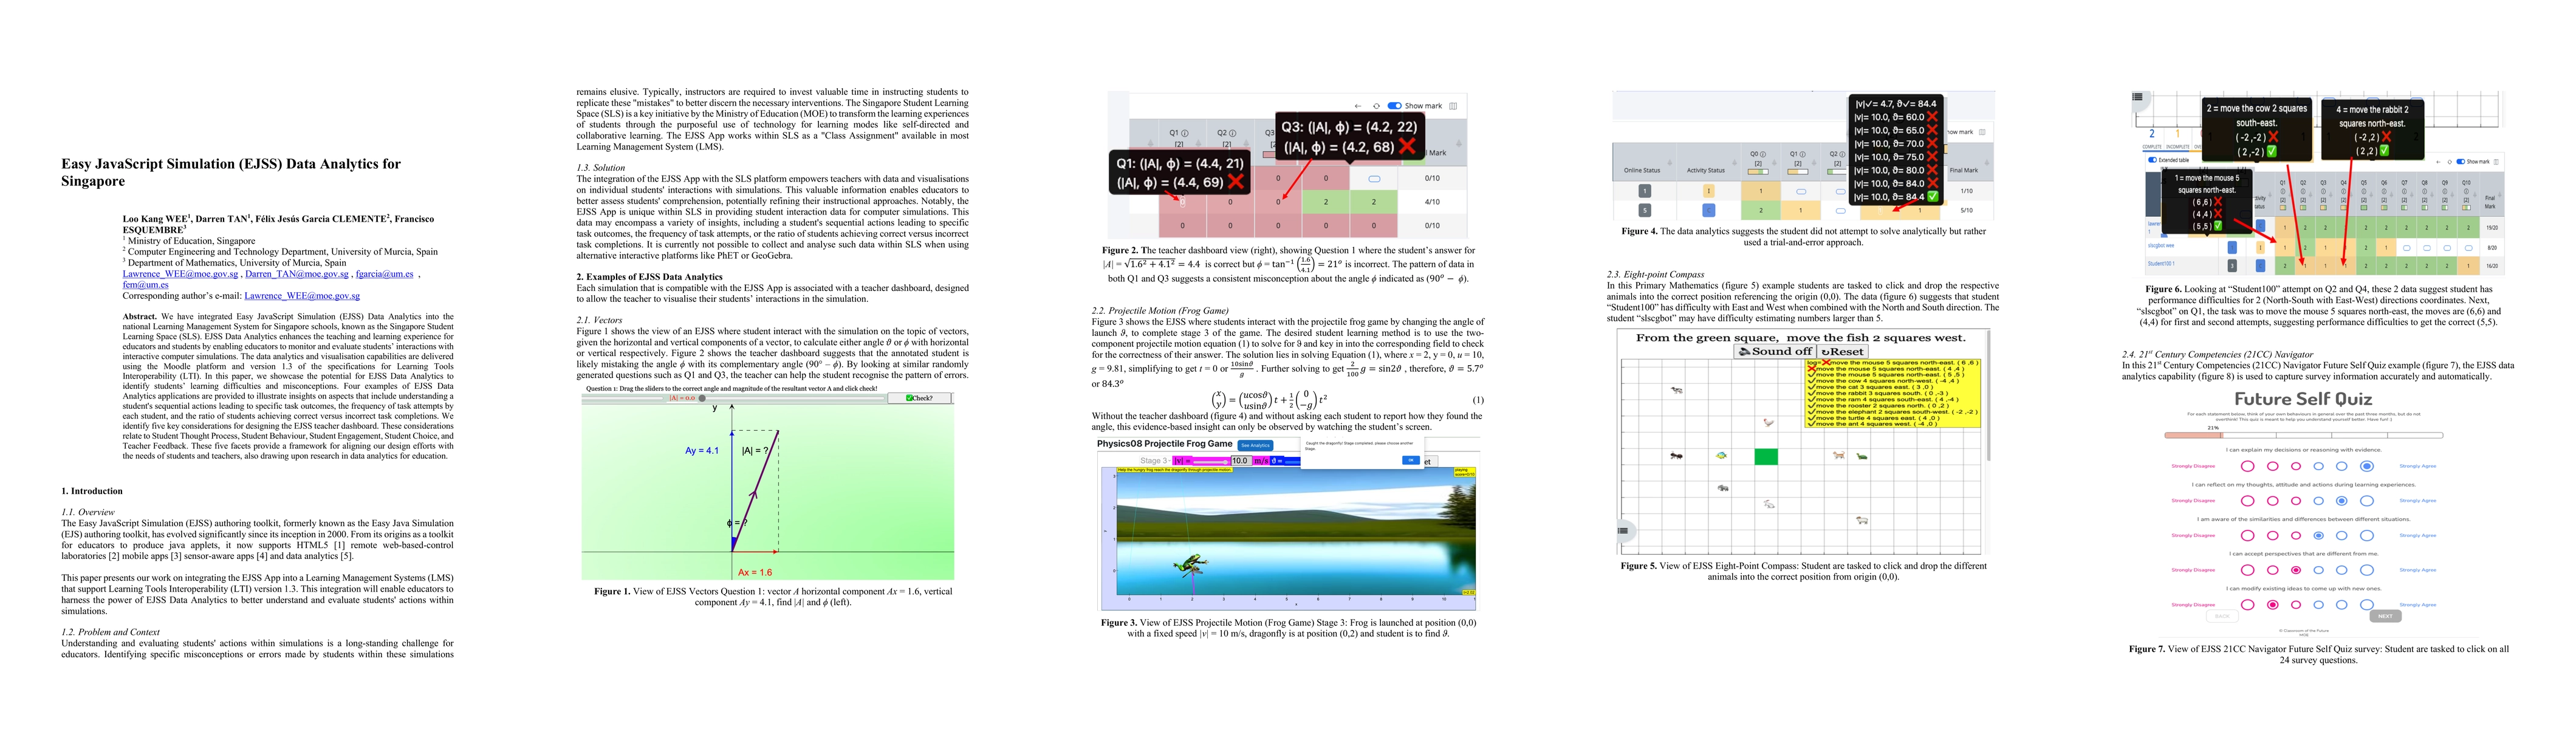
We have integrated Easy JavaScript Simulation (EJSS) Data Analytics into the national Learning Management System for Singapore schools, known as the Singapore Student Learning Space (SLS). EJSS Data Analytics enhances the teaching and learning experience for educators and students by enabling educators to monitor and evaluate students interactions with interactive computer simulations. The data analytics and visualisation capabilities are delivered using the Moodle platform and version 1.3 of the specifications for Learning Tools Interoperability (LTI). In this paper, we showcase the potential for EJSS Data Analytics to identify students learning difficulties and misconceptions. Four examples of EJSS Data Analytics applications are provided to illustrate insights on aspects that include understanding a students sequential actions leading to specific task outcomes, the frequency of task attempts by each student, and the ratio of students achieving correct versus incorrect task completions. We identify five key considerations for designing the EJSS teacher dashboard. These considerations relate to Student Thought Process, Student Behaviour, Student Engagement, Student Choice, and Teacher Feedback. These five facets provide a framework for aligning our design efforts with the needs of students and teachers, also drawing upon research in data analytics for education.
AI Key Findings
Get AI-generated insights about this paper's methodology, results, significance, and more — seven facets brought into focus.
Impact
Paper Details
Authors
PDF Preview
Key Terms
Citation Network
Current paper (gray), citations (green), references (blue)
Display is limited for performance on very large graphs.
Discussion 0