easyFermi: a graphical interface for performing Fermi-LAT data analyses
Publication
Metrics
AI Quick Summary
easyFermi offers a user-friendly graphical interface for Fermi-LAT data analysis, simplifying tasks like measuring gamma-ray flux and building spectral energy distributions, and is available open-source with tutorials on YouTube and GitHub.
Paper Preview
Abstract
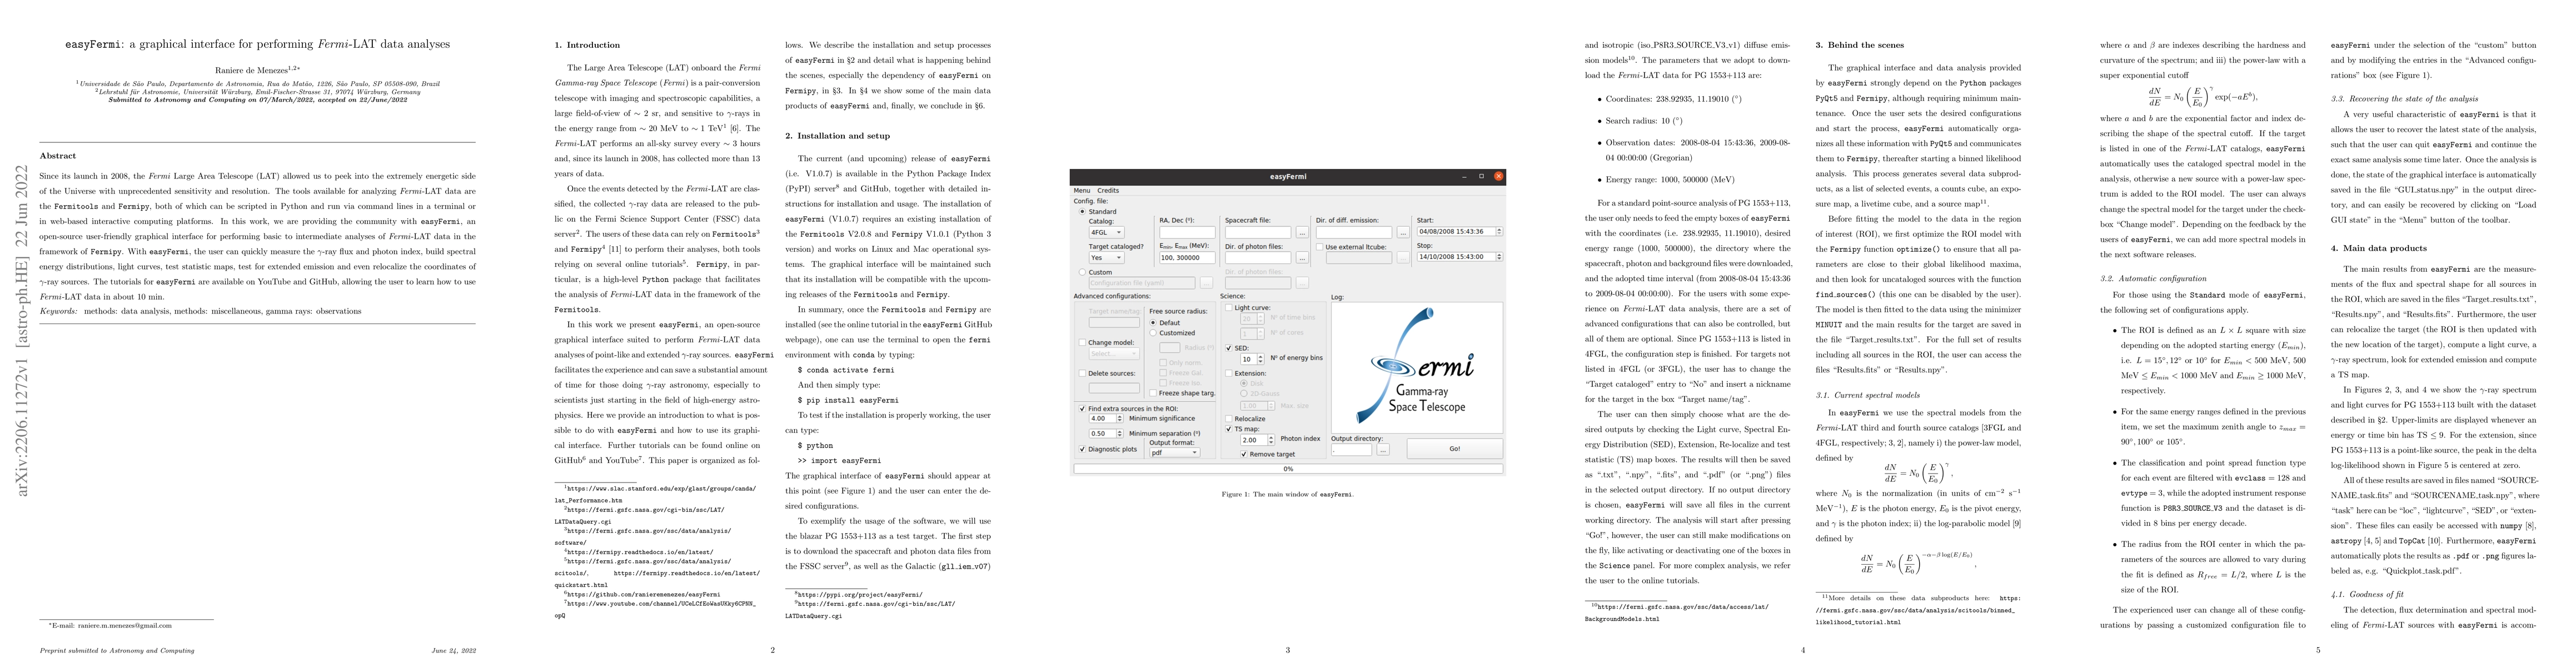
Since its launch in 2008, the Fermi Large Area Telescope (LAT) allowed us to peek into the extremely energetic side of the Universe with unprecedented sensitivity and resolution. The tools available for analyzing Fermi-LAT data are the Fermitools and Fermipy, both of which can be scripted in Python and run via command lines in a terminal or in web-based interactive computing platforms. In this work, we are providing the community with easyFermi, an open-source user-friendly graphical interface for performing basic to intermediate analyses of Fermi-LAT data in the framework of Fermipy. With easyFermi, the user can quickly measure the $\gamma$-ray flux and photon index, build spectral energy distributions, light curves, test statistic maps, test for extended emission and even relocalize the coordinates of $\gamma$-ray sources. The tutorials for easyFermi are available on YouTube and GitHub, allowing the user to learn how to use Fermi-LAT data in about 10 min.
AI Key Findings
Get AI-generated insights about this paper's methodology, results, significance, and more — seven facets brought into focus.
Impact
Paper Details
Authors
PDF Preview
Key Terms
Citation Network
Current paper (gray), citations (green), references (blue)
Display is limited for performance on very large graphs.
Discussion 0