easylayout: an R package for interactive force-directed layouts within RStudio
Publication
Metrics
AI Quick Summary
The easylayout R package facilitates interactive force-directed network layouts within RStudio, bridging network manipulation and visualization by leveraging Shiny and web technologies for real-time adjustments. It is designed to reduce the time spent on network layout and improve the generation of compelling figures.
Paper Preview
Abstract
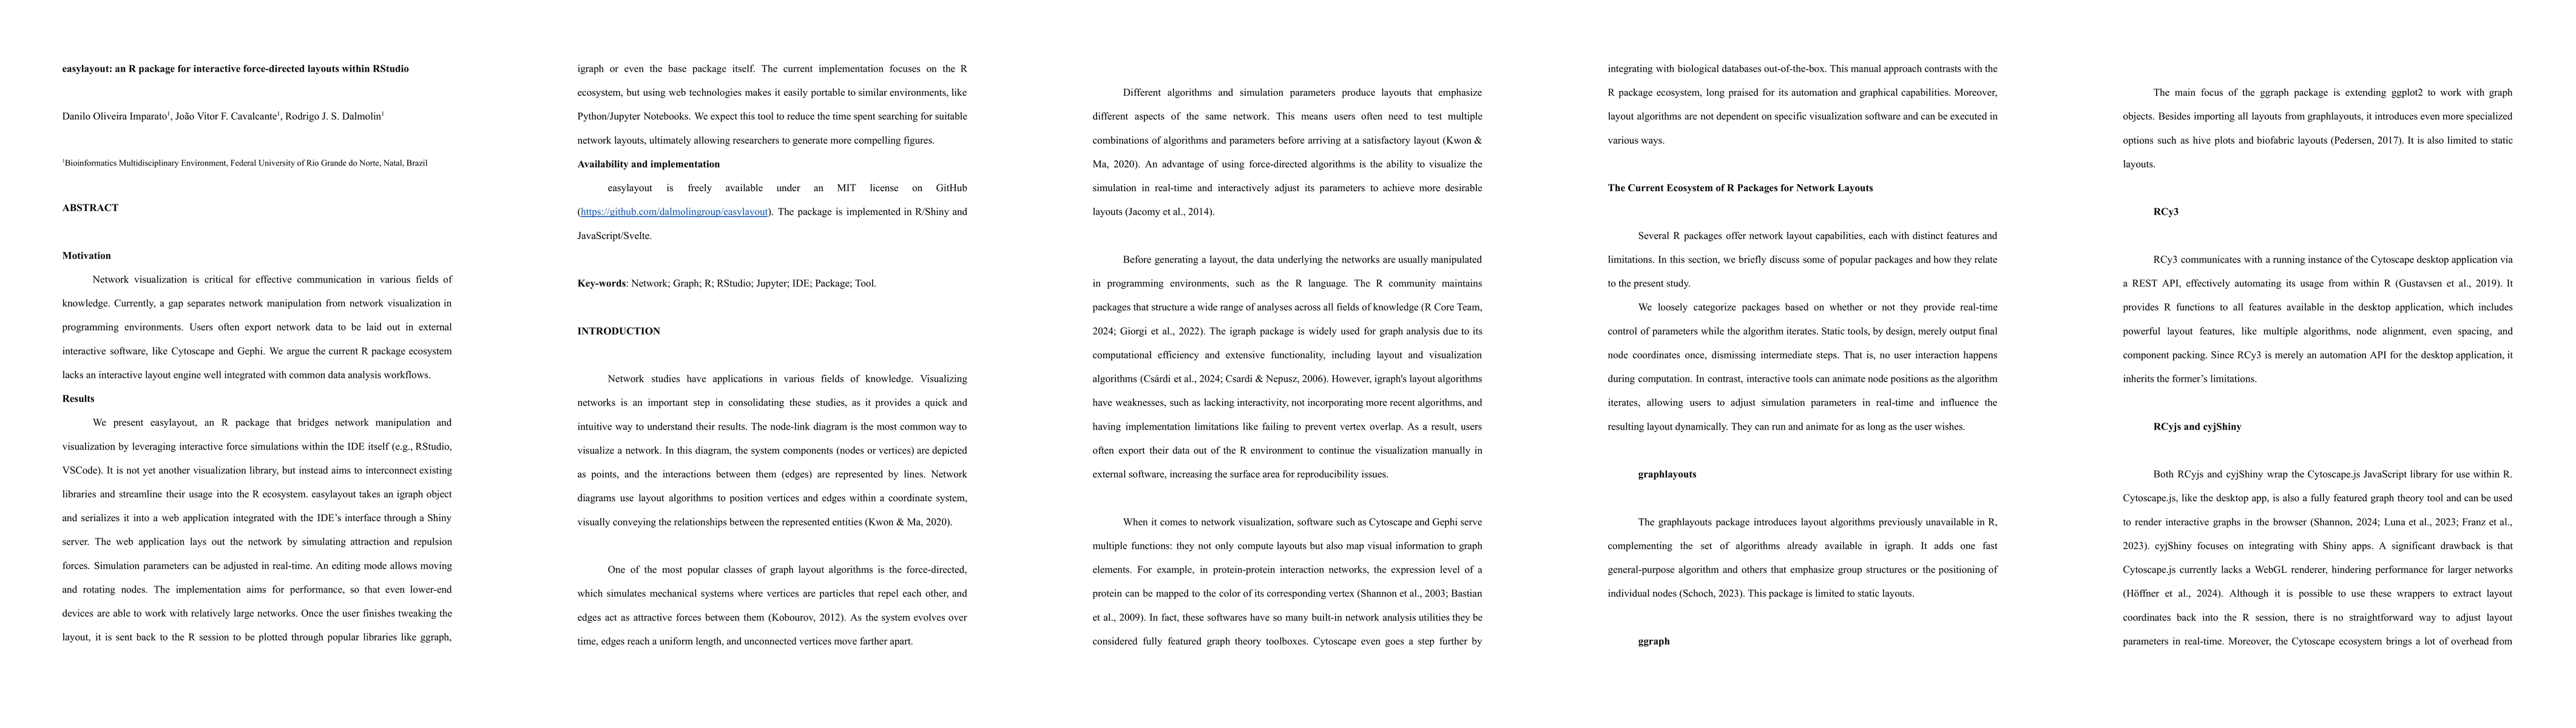
Motivation Network visualization is critical for effective communication in various fields of knowledge. Currently, a gap separates network manipulation from network visualization in programming environments. Users often export network data to be laid out in external interactive software, like Cytoscape and Gephi. We argue the current R package ecosystem lacks an interactive layout engine well integrated with common data analysis workflows. Results We present easylayout, an R package that bridges network manipulation and visualization by leveraging interactive force simulations within the IDE itself (e.g., RStudio, VSCode). It is not yet another visualization library, but instead aims to interconnect existing libraries and streamline their usage into the R ecosystem. easylayout takes an igraph object and serializes it into a web application integrated with the IDE's interface through a Shiny server. The app lays out the network by simulating attraction and repulsion forces. Simulation parameters can be adjusted in real-time. An editing mode allows moving and rotating nodes. The implementation aims for performance, so that even lower-end devices are able to work with relatively large networks. Once the user finishes tweaking the layout, it is sent back to the R session to be plotted through popular libraries like ggraph, igraph or even the base package itself. The current implementation focuses on the R ecosystem, but using web technologies makes it easily portable to similar environments, like Python/Jupyter Notebooks. We expect this tool to reduce the time spent searching for suitable network layouts, ultimately allowing researchers to generate more compelling figures. Availability and implementation easylayout is freely available under an MIT license on GitHub (https://github.com/dalmolingroup/easylayout). The package is implemented in R/Shiny and JavaScript/Svelte.
AI Key Findings
Get AI-generated insights about this paper's methodology, results, significance, and more — seven facets brought into focus.
Impact
Authors
PDF Preview
Citation Network
Current paper (gray), citations (green), references (blue)
Display is limited for performance on very large graphs.
Discussion 0