EB-GAME: A Game-Changer in ECG Heartbeat Anomaly Detection
Publication
Metrics
AI Quick Summary
EB-GAME employs GAN-based unsupervised learning to detect arrhythmias in ECGs using only normal signal labels. It achieved state-of-the-art performance on the MIT-BIH Arrhythmia Dataset by addressing the scarcity of abnormal ECG data.
Paper Preview
Abstract
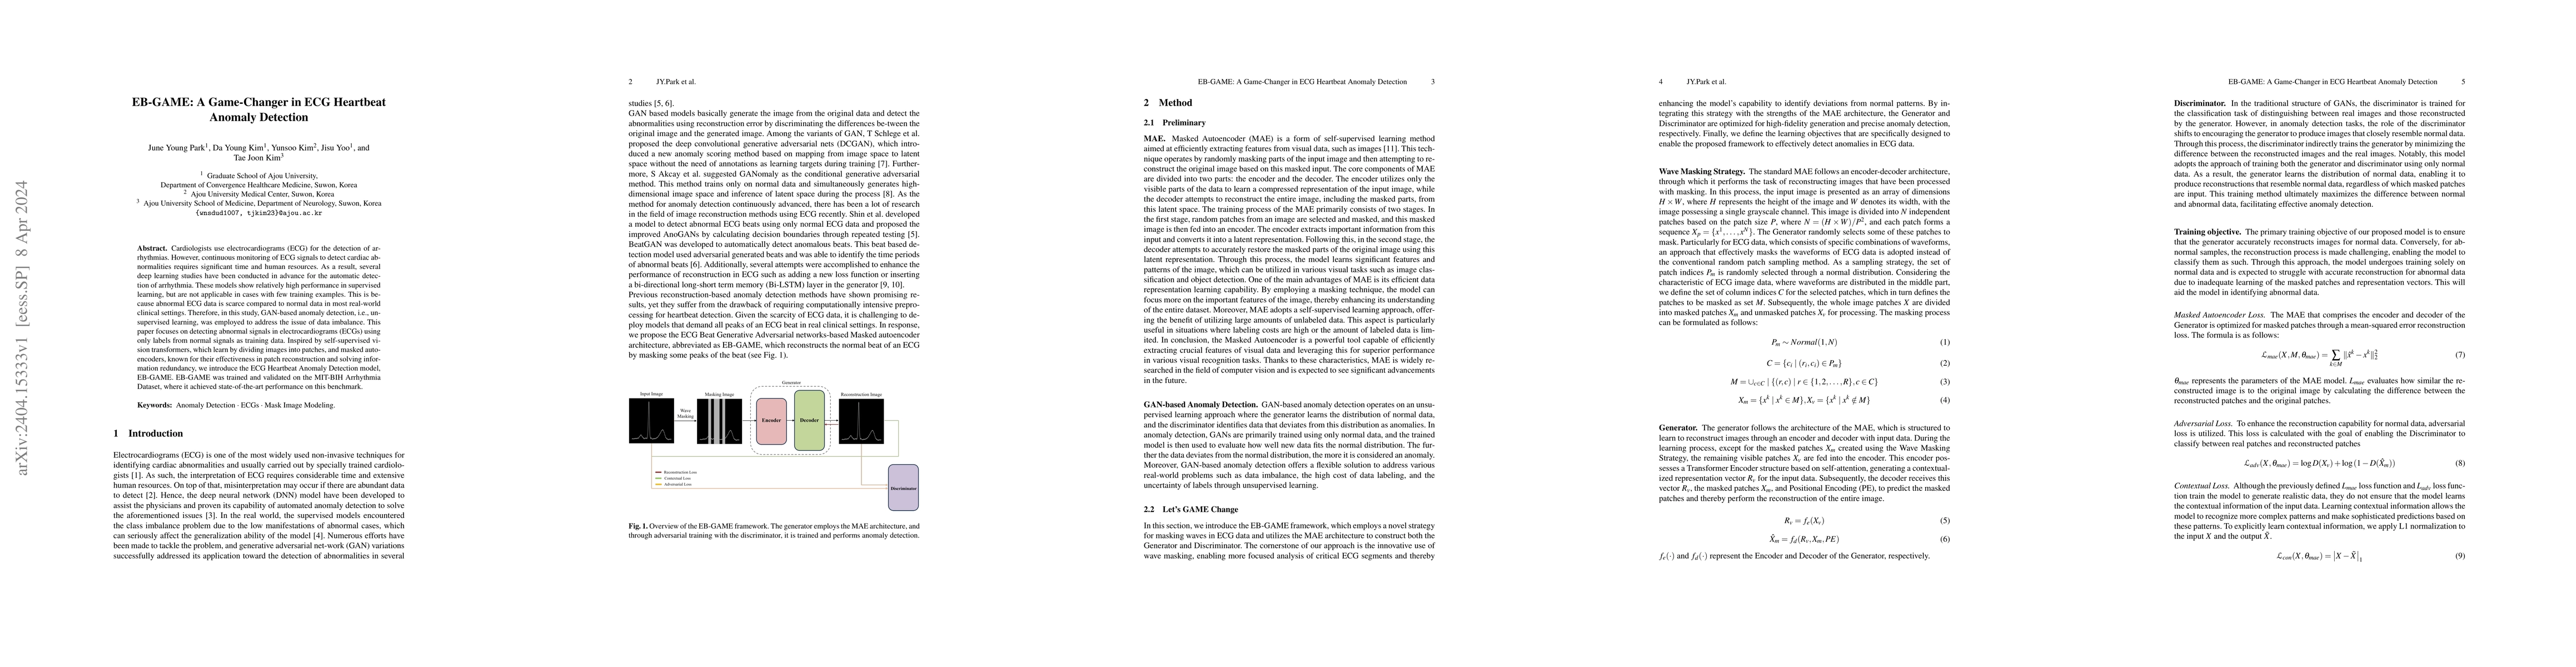
Cardiologists use electrocardiograms (ECG) for the detection of arrhythmias. However, continuous monitoring of ECG signals to detect cardiac abnormal-ities requires significant time and human resources. As a result, several deep learning studies have been conducted in advance for the automatic detection of arrhythmia. These models show relatively high performance in supervised learning, but are not applicable in cases with few training examples. This is because abnormal ECG data is scarce compared to normal data in most real-world clinical settings. Therefore, in this study, GAN-based anomaly detec-tion, i.e., unsupervised learning, was employed to address the issue of data imbalance. This paper focuses on detecting abnormal signals in electrocardi-ograms (ECGs) using only labels from normal signals as training data. In-spired by self-supervised vision transformers, which learn by dividing images into patches, and masked auto-encoders, known for their effectiveness in patch reconstruction and solving information redundancy, we introduce the ECG Heartbeat Anomaly Detection model, EB-GAME. EB-GAME was trained and validated on the MIT-BIH Arrhythmia Dataset, where it achieved state-of-the-art performance on this benchmark.
AI Key Findings
Get AI-generated insights about this paper's methodology, results, significance, and more — seven facets brought into focus.
Impact
Paper Details
Authors
PDF Preview
Key Terms
Citation Network
Current paper (gray), citations (green), references (blue)
Display is limited for performance on very large graphs.
Discussion 0