Eccentric pie charts and an unusual pie cutting
Publication
Metrics
Paper Preview
Abstract
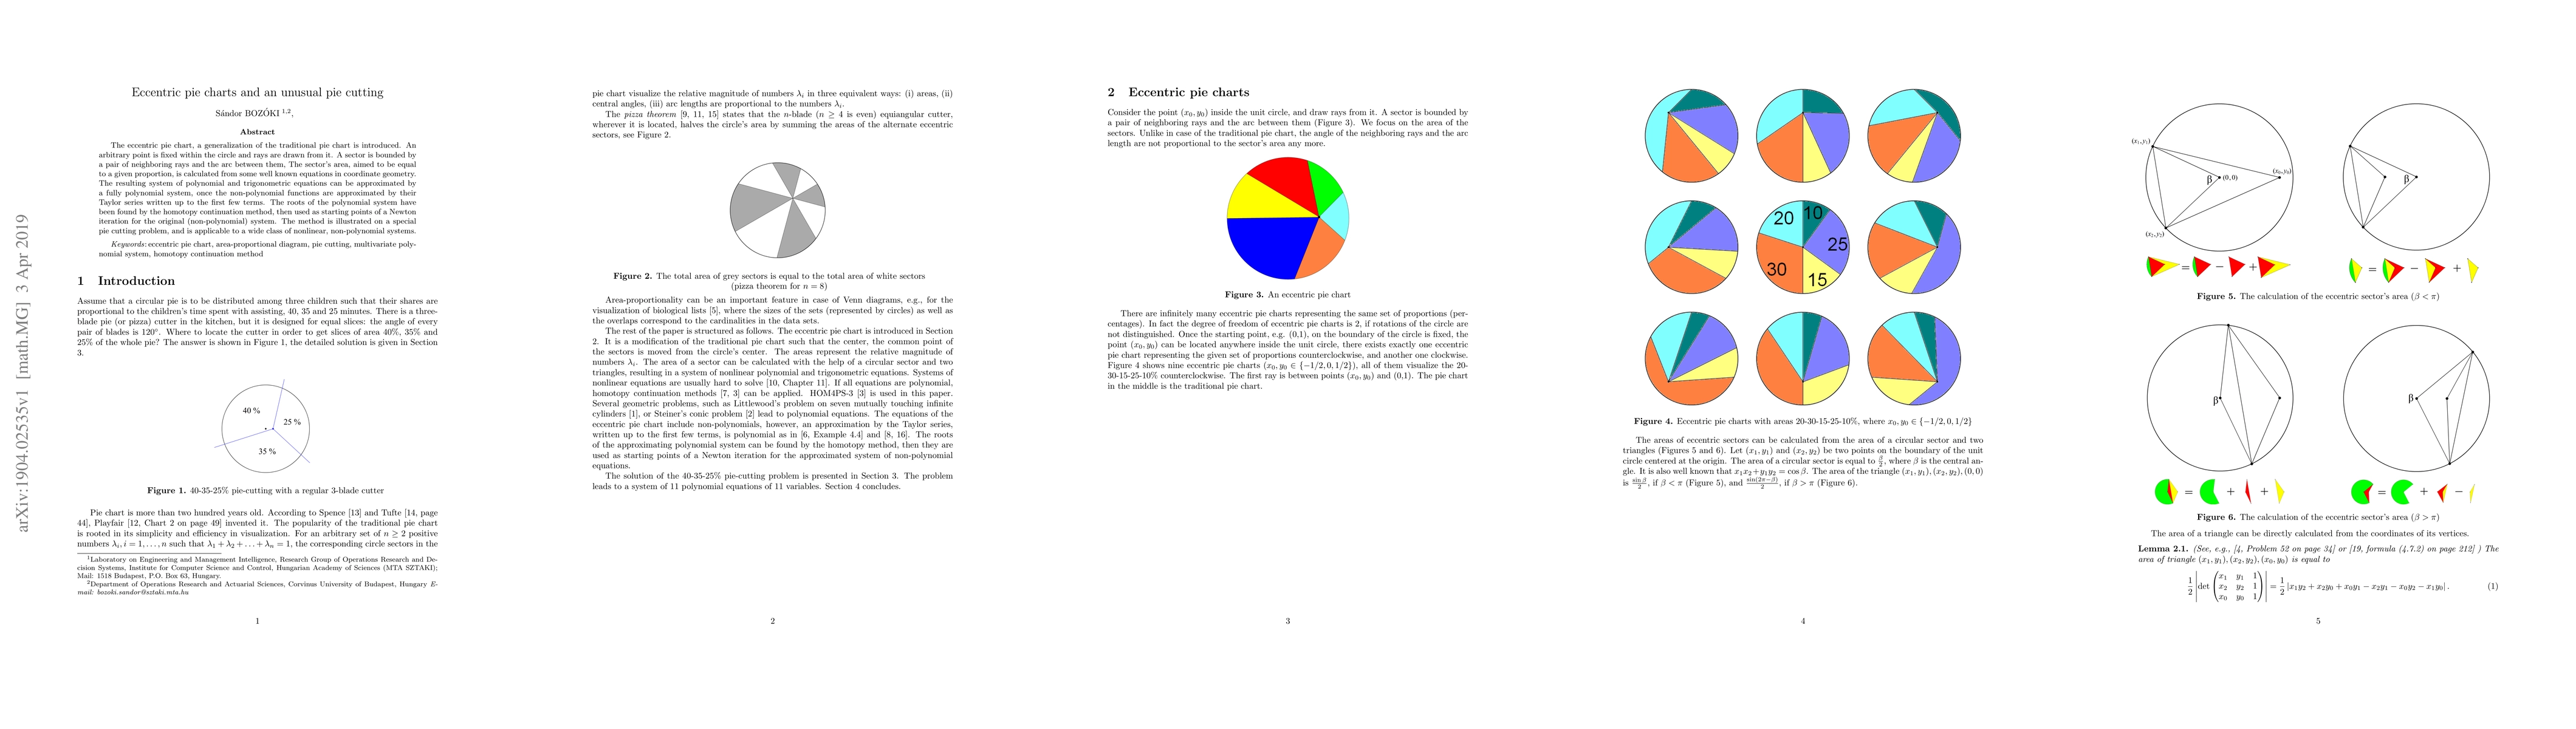
The eccentric pie chart, a generalization of the traditional pie chart is introduced. An arbitrary point is fixed within the circle and rays are drawn from it. A sector is bounded by a pair of neighboring rays and the arc between them, The sector's area, aimed to be equal to a given proportion, is calculated from some well known equations in coordinate geometry. The resulting system of polynomial and trigonometric equations can be approximated by a fully polynomial system, once the non-polynomial functions are approximated by their Taylor series written up to the first few terms. The roots of the polynomial system have been found by the homotopy continuation method, then used as starting points of a Newton iteration for the original (non-polynomial) system. The method is illustrated on a special pie cutting problem, and is applicable to a wide class of nonlinear, non-polynomial systems.
AI Key Findings
Get AI-generated insights about this paper's methodology, results, significance, and more — seven facets brought into focus.
Impact
Paper Details
Authors
PDF Preview
Key Terms
Citation Network
Current paper (gray), citations (green), references (blue)
Display is limited for performance on very large graphs.
Discussion 0