Education Stats Made Visible: Helping School District Managers Write Better Three-Year Plans
Publication
Metrics
AI Quick Summary
This paper describes a project to help California school district managers utilize data to write better three-year plans by providing a comparative methodology and data visualization environment. A Tableau-based dashboard was developed, integrating ten years of diverse data, and each district received a custom workbook contextualizing its performance among similar districts.
Paper Preview
Abstract
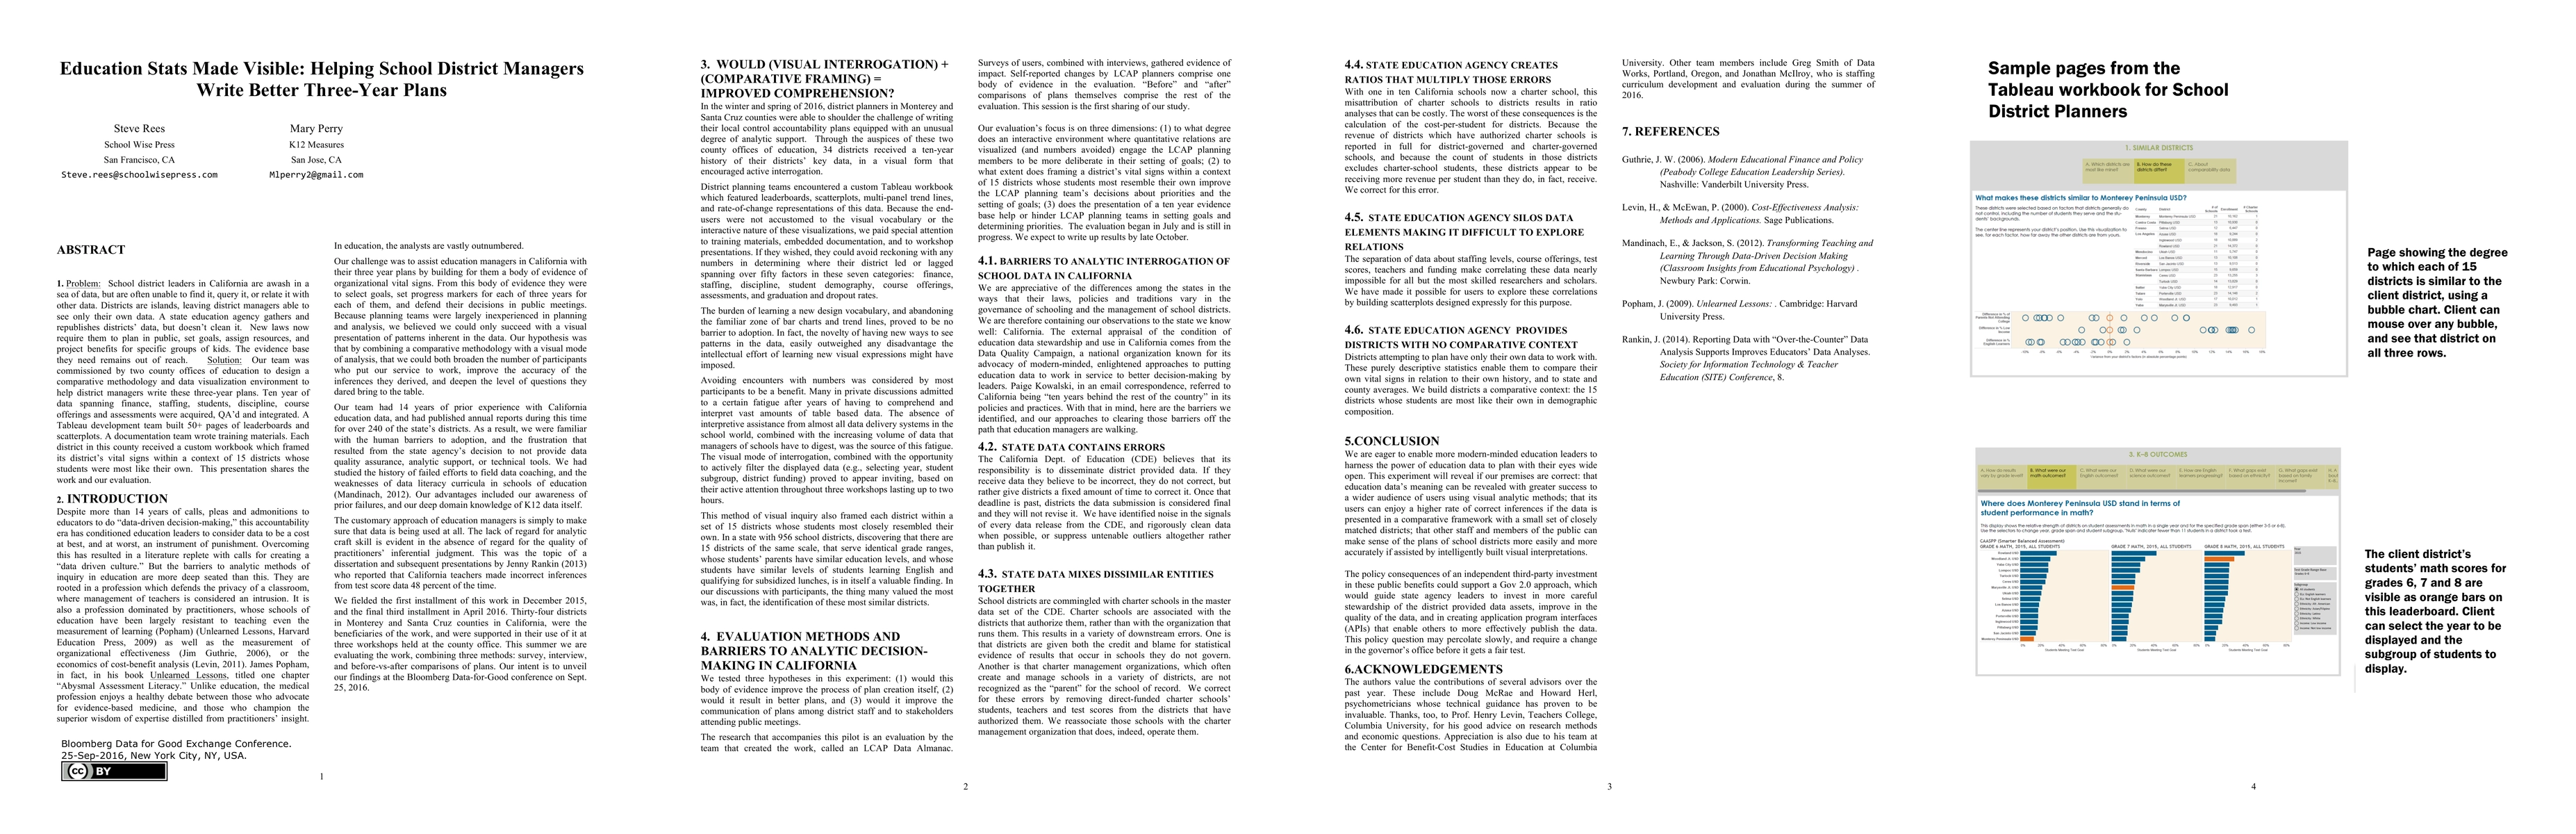
Problem: School district leaders in California are awash in a sea of data, but are often unable to find it, query it, or relate it with other data. Districts are islands, leaving district managers able to see only their own data. A state education agency gathers and republishes districts' data, but doesn't clean it. New laws now require them to plan in public, set goals, assign resources, and project benefits for specific groups of kids. The evidence base they need remains out of reach. Solution: Our team was commissioned by two county offices of education to design a comparative methodology and data visualization environment to help district managers write these three-year plans. Ten year of data spanning finance, staffing, students, discipline, course offerings and assessments were acquired, QA'd and integrated. A Tableau development team built 50+ pages of leaderboards and scatterplots. A documentation team wrote training materials. Each district in this county received a custom workbook which framed its district's vital signs within a context of 15 districts whose students were most like their own. This presentation shares the work and our evaluation.
AI Key Findings
Get AI-generated insights about this paper's methodology, results, significance, and more — seven facets brought into focus.
Impact
Paper Details
PDF Preview
Key Terms
Citation Network
Current paper (gray), citations (green), references (blue)
Display is limited for performance on very large graphs.
Discussion 0