EEG-based Emotional Video Classification via Learning Connectivity Structure
Publication
Metrics
AI Quick Summary
This paper proposes an end-to-end neural network model for EEG-based emotional video classification that automatically extracts multi-layer graph structures and signal features from raw EEG data, achieving superior classification performance compared to methods using manually defined connectivity. The model's learned graph structures correlate well with emotional perception in the brain.
Paper Preview
Abstract
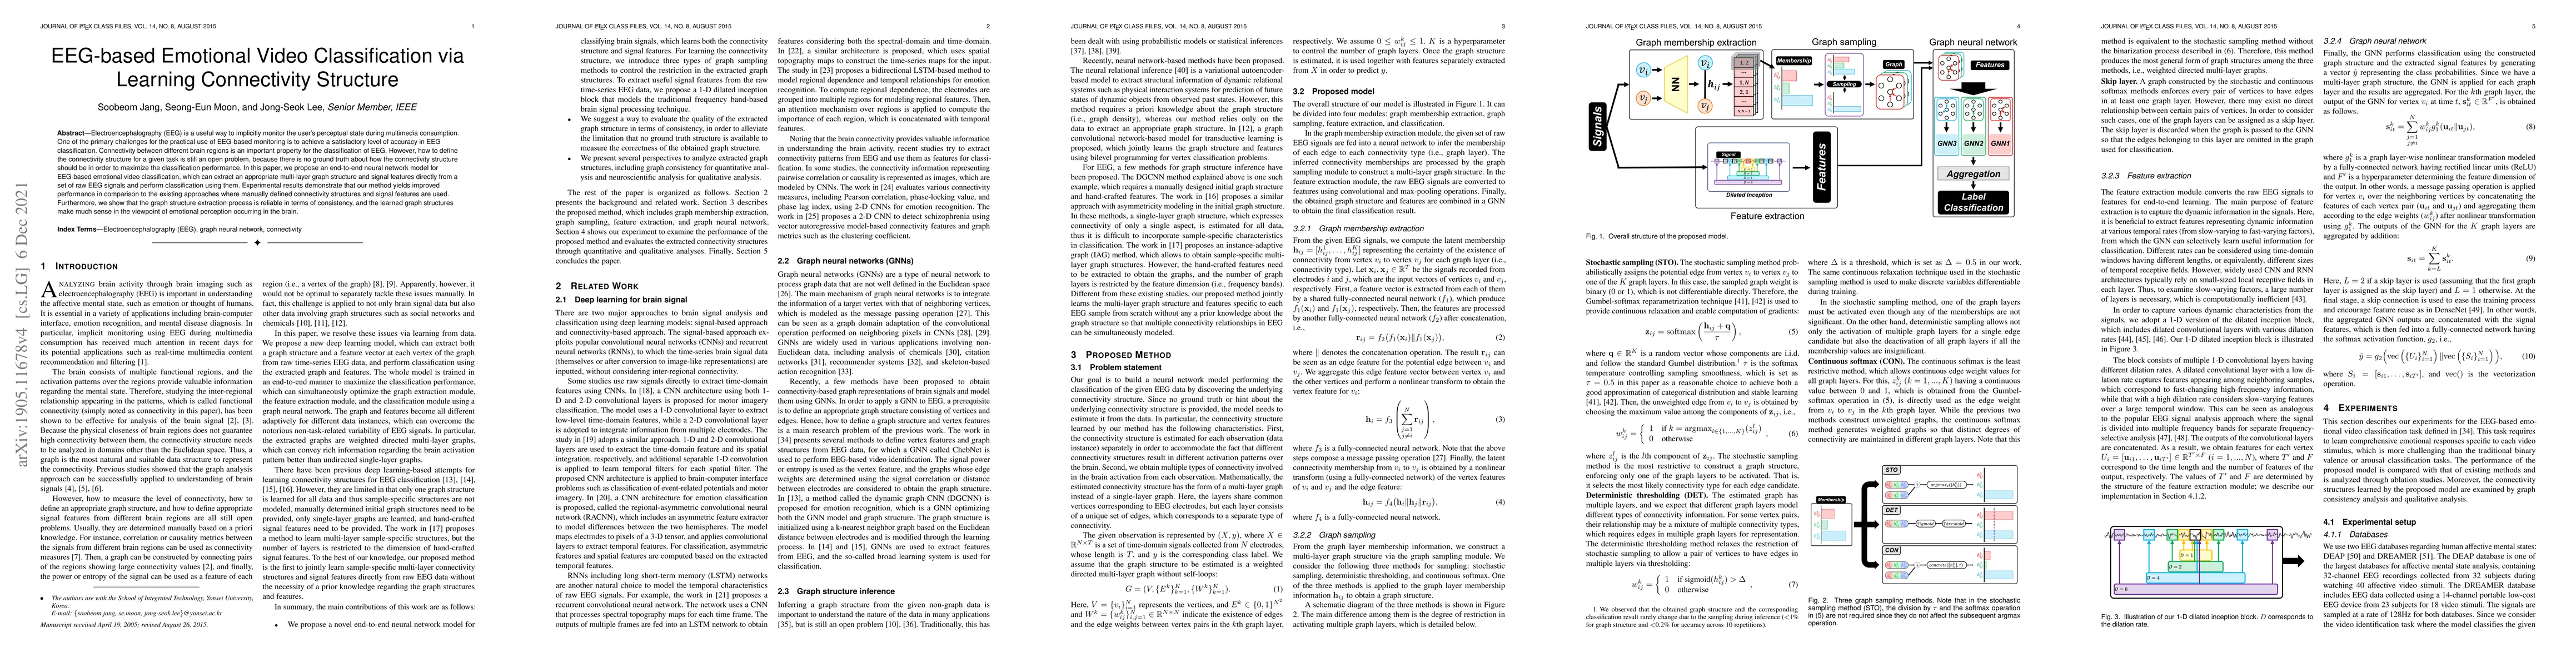
Electroencephalography (EEG) is a useful way to implicitly monitor the users perceptual state during multimedia consumption. One of the primary challenges for the practical use of EEG-based monitoring is to achieve a satisfactory level of accuracy in EEG classification. Connectivity between different brain regions is an important property for the classification of EEG. However, how to define the connectivity structure for a given task is still an open problem, because there is no ground truth about how the connectivity structure should be in order to maximize the classification performance. In this paper, we propose an end-to-end neural network model for EEG-based emotional video classification, which can extract an appropriate multi-layer graph structure and signal features directly from a set of raw EEG signals and perform classification using them. Experimental results demonstrate that our method yields improved performance in comparison to the existing approaches where manually defined connectivity structures and signal features are used. Furthermore, we show that the graph structure extraction process is reliable in terms of consistency, and the learned graph structures make much sense in the viewpoint of emotional perception occurring in the brain.
AI Key Findings
Get AI-generated insights about this paper's methodology, results, significance, and more — seven facets brought into focus.
Impact
Paper Details
Authors
PDF Preview
Key Terms
Citation Network
Current paper (gray), citations (green), references (blue)
Display is limited for performance on very large graphs.
Discussion 0