Publication
Metrics
AI Quick Summary
This paper proposes a generative detection network (GDN) to classify EEG signals into depressed and control groups based on learned brain activity patterns. The model achieved high accuracy on two datasets and provides explainable outputs to help identify potential misclassifications.
Paper Preview
Abstract
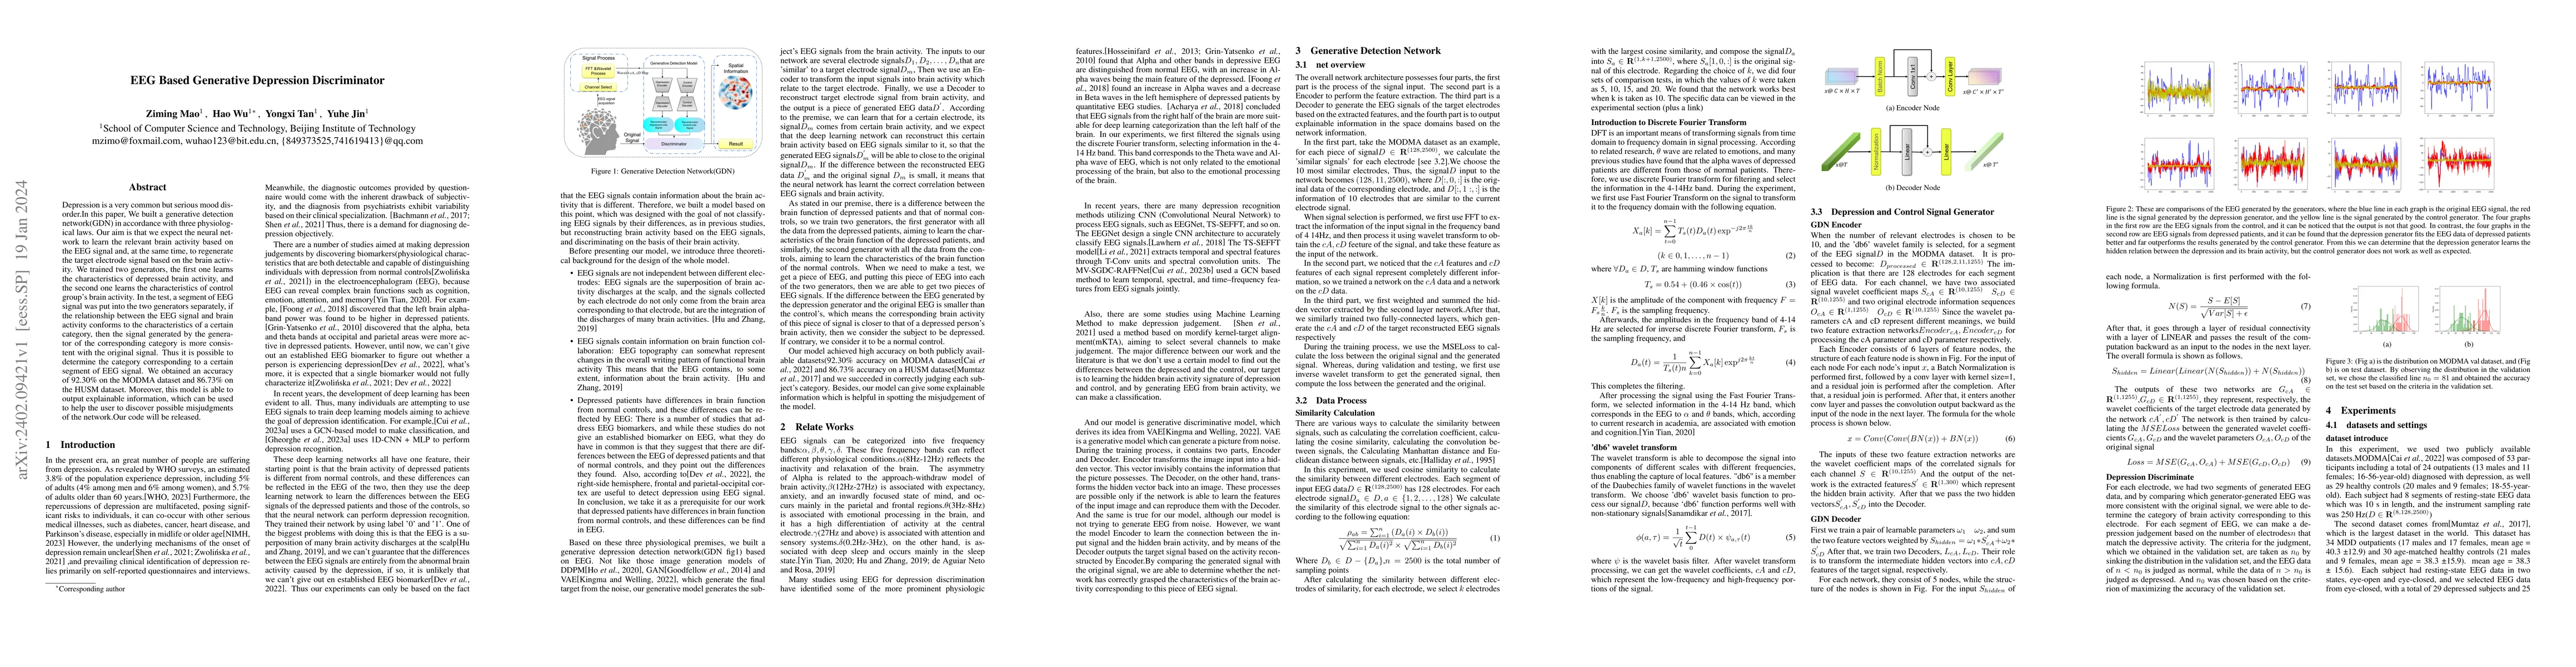
Depression is a very common but serious mood disorder.In this paper, We built a generative detection network(GDN) in accordance with three physiological laws. Our aim is that we expect the neural network to learn the relevant brain activity based on the EEG signal and, at the same time, to regenerate the target electrode signal based on the brain activity. We trained two generators, the first one learns the characteristics of depressed brain activity, and the second one learns the characteristics of control group's brain activity. In the test, a segment of EEG signal was put into the two generators separately, if the relationship between the EEG signal and brain activity conforms to the characteristics of a certain category, then the signal generated by the generator of the corresponding category is more consistent with the original signal. Thus it is possible to determine the category corresponding to a certain segment of EEG signal. We obtained an accuracy of 92.30\% on the MODMA dataset and 86.73\% on the HUSM dataset. Moreover, this model is able to output explainable information, which can be used to help the user to discover possible misjudgments of the network.Our code will be released.
AI Key Findings
Get AI-generated insights about this paper's methodology, results, significance, and more — seven facets brought into focus.
Impact
Paper Details
Authors
PDF Preview
Key Terms
Citation Network
Current paper (gray), citations (green), references (blue)
Display is limited for performance on very large graphs.
Discussion 0