Effect of hyperparameters on variable selection in random forests
Publication
Metrics
AI Quick Summary
This study investigates how hyperparameters in random forests affect variable selection procedures, finding that the proportion of splitting candidate variables and the sample fraction for training datasets significantly influence selection outcomes. The results suggest that default hyperparameter settings may not always be optimal for identifying important variables, with the best settings varying depending on the correlation structure of predictor variables and the study's goals.
Paper Preview
Abstract
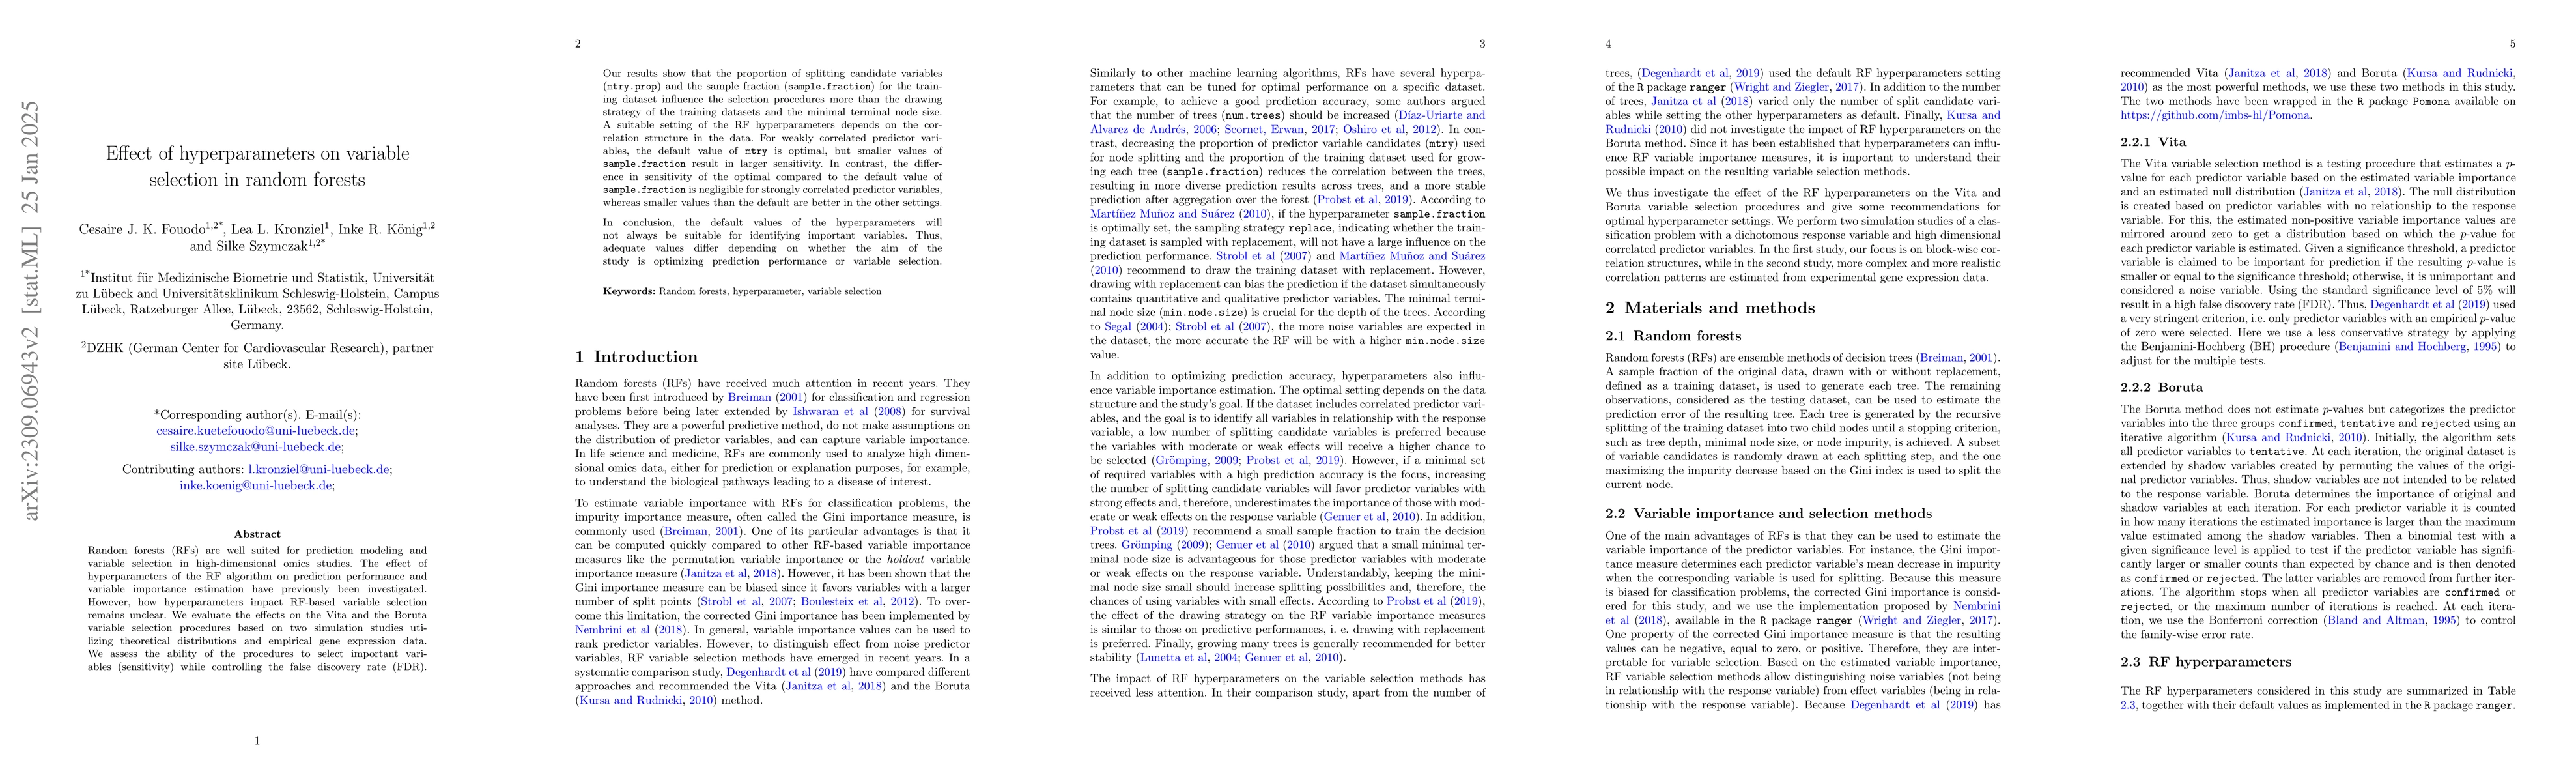
Random forests (RFs) are well suited for prediction modeling and variable selection in high-dimensional omics studies. The effect of hyperparameters of the RF algorithm on prediction performance and variable importance estimation have previously been investigated. However, how hyperparameters impact RF-based variable selection remains unclear. We evaluate the effects on the Vita and the Boruta variable selection procedures based on two simulation studies utilizing theoretical distributions and empirical gene expression data. We assess the ability of the procedures to select important variables (sensitivity) while controlling the false discovery rate (FDR). Our results show that the proportion of splitting candidate variables (mtry.prop) and the sample fraction (sample.fraction) for the training dataset influence the selection procedures more than the drawing strategy of the training datasets and the minimal terminal node size. A suitable setting of the RF hyperparameters depends on the correlation structure in the data. For weakly correlated predictor variables, the default value of mtry is optimal, but smaller values of sample.fraction result in larger sensitivity. In contrast, the difference in sensitivity of the optimal compared to the default value of sample.fraction is negligible for strongly correlated predictor variables, whereas smaller values than the default are better in the other settings. In conclusion, the default values of the hyperparameters will not always be suitable for identifying important variables. Thus, adequate values differ depending on whether the aim of the study is optimizing prediction performance or variable selection.
AI Key Findings
Get AI-generated insights about this paper's methodology, results, significance, and more — seven facets brought into focus.
Impact
Paper Details
Authors
PDF Preview
Key Terms
Citation Network
Current paper (gray), citations (green), references (blue)
Display is limited for performance on very large graphs.
Discussion 0