Publication
Metrics
AI Quick Summary
This paper investigates how stellar spots affect high-precision transit light curves, revealing that spot anomalies can lead to a 4% underestimation of a planet's radius and significant variations in transit duration and timing. The study concludes that spots larger than 0.03 times the stellar radius can produce detectable effects, but additional fitting parameters do not improve accuracy for active stars.
Paper Preview
Abstract
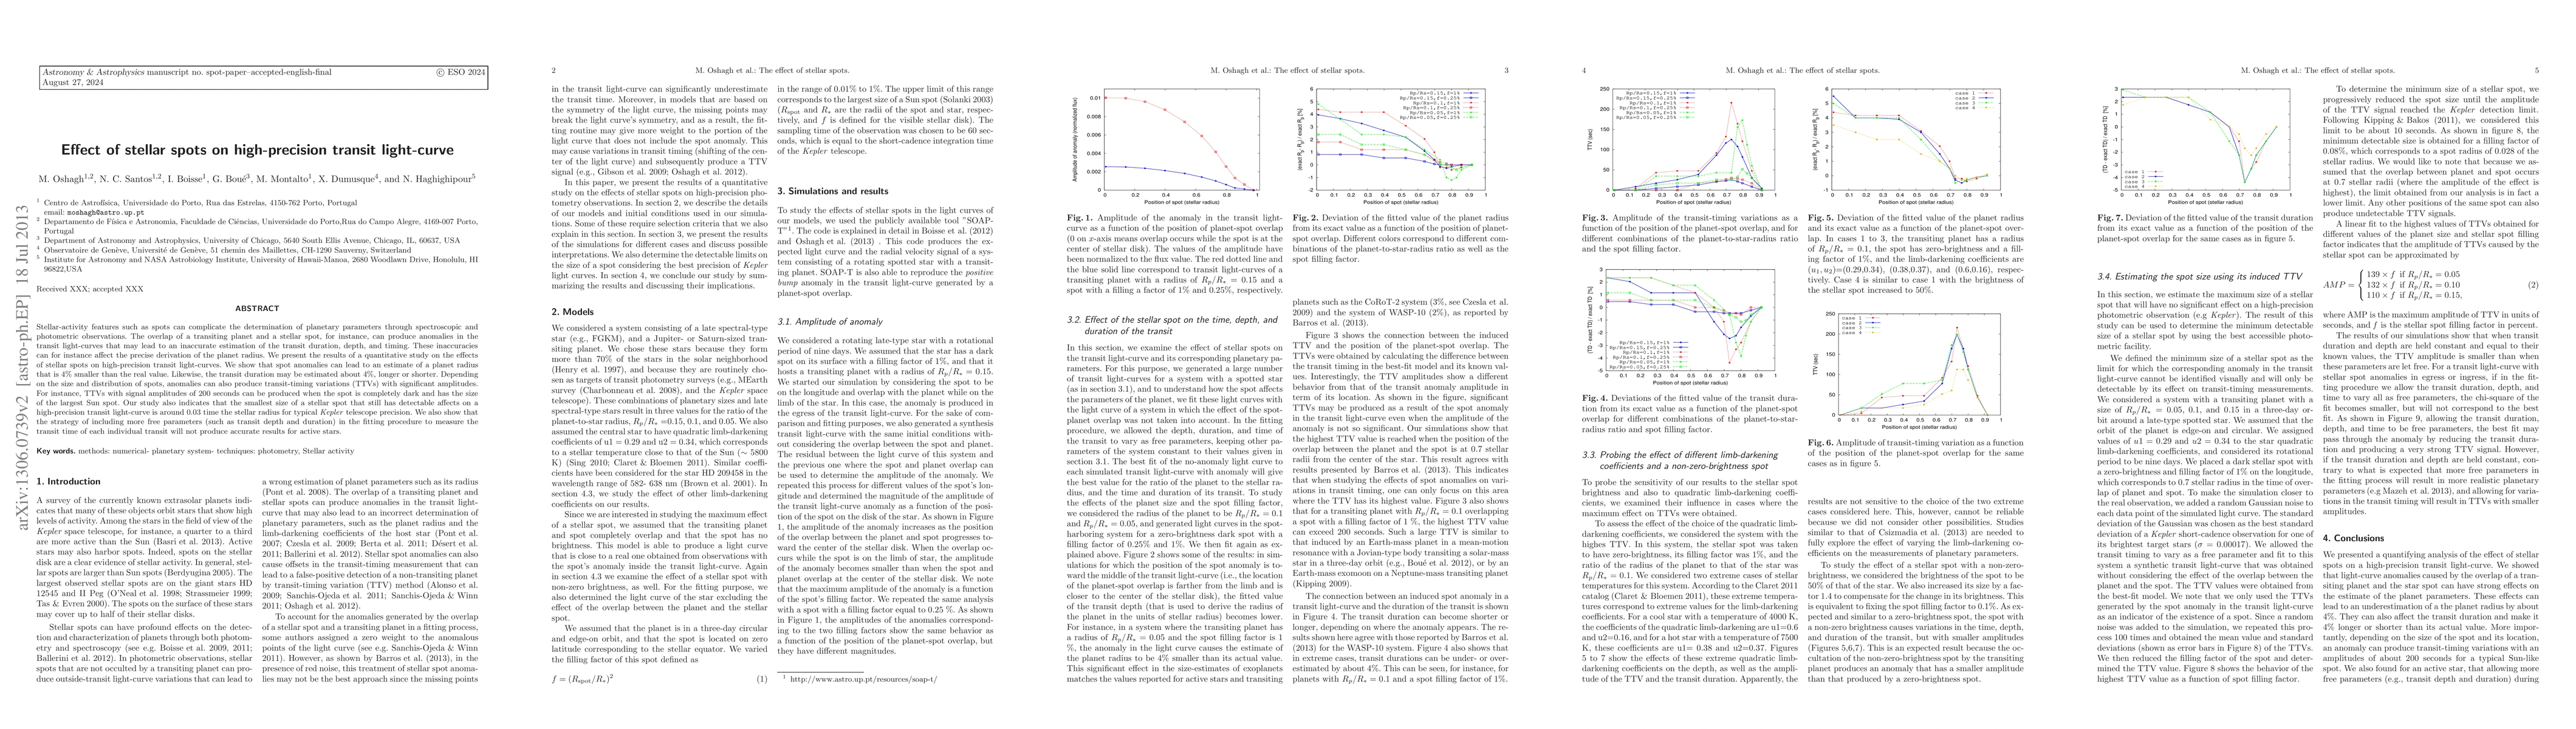
Stellar activity features such as spots can create complications in determining planetary parameters through spectroscopic and photometric observations. The overlap of a transiting planet and a stellar spot, for instance, can produce anomalies in the transit light curves that may lead to inaccurate estimation of the transit duration, depth and timing. For instance such inaccuracies can affect the precise derivation of the planet's radius. In this paper, we present the results of a quantitative study on the effects of stellar spots on high precision transit light curves. We show that spot anomalies can lead to the estimate of a planet radius that is 4% smaller than the real value. The effects on the transit duration can also be of the order of 4%, longer or shorter. Depending on the size and distribution of spots, anomalies can also produce transit timing variations with significant amplitudes. For instance, TTVs with signal amplitudes of 200 seconds can be produced when the spot is completely dark and as large as the largest Sun spot. Our study also indicates that the minimum size of a stellar spot with detectable affects on the high precision transit light curve is around 0.03 time the stellar radius for typical Kepler telescope precision. We also show that the strategy of including more free parameters (such as transit depth and duration) in the fitting procedure to measure the transit time of each individual transit will not produce accurate results in the case of active stars.
AI Key Findings
Get AI-generated insights about this paper's methodology, results, significance, and more — seven facets brought into focus.
Impact
Paper Details
PDF Preview
Key Terms
Citation Network
Current paper (gray), citations (green), references (blue)
Display is limited for performance on very large graphs.
Discussion 0