Efficient adjustment sets for population average treatment effect estimation in non-parametric causal graphical models
Publication
Metrics
AI Quick Summary
This paper extends graphical criteria for determining optimal covariate adjustment sets in non-parametric causal graphical models for estimating population average treatment effects. It introduces new graphical rules for comparing and selecting adjustment sets, including time-dependent sets, and shows that uniformly optimal time-dependent adjustment sets may not always exist.
Paper Preview
Abstract
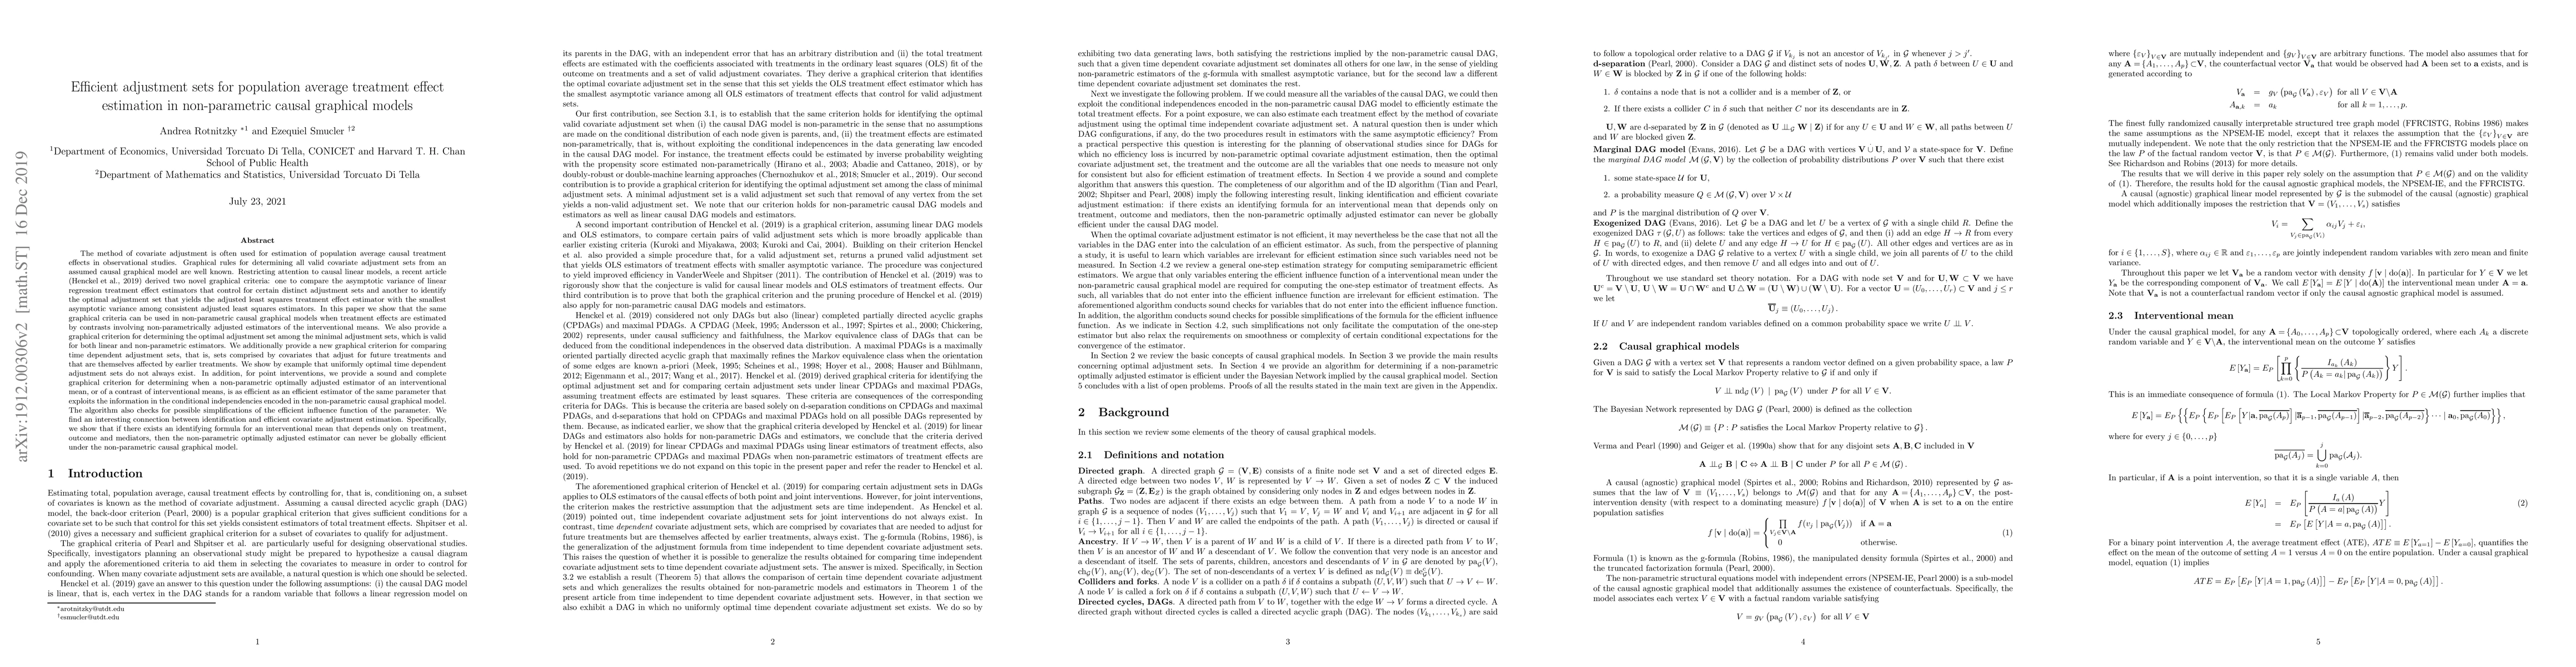
The method of covariate adjustment is often used for estimation of population average treatment effects in observational studies. Graphical rules for determining all valid covariate adjustment sets from an assumed causal graphical model are well known. Restricting attention to causal linear models, a recent article derived two novel graphical criteria: one to compare the asymptotic variance of linear regression treatment effect estimators that control for certain distinct adjustment sets and another to identify the optimal adjustment set that yields the least squares treatment effect estimator with the smallest asymptotic variance among consistent adjusted least squares estimators. In this paper we show that the same graphical criteria can be used in non-parametric causal graphical models when treatment effects are estimated by contrasts involving non-parametrically adjusted estimators of the interventional means. We also provide a graphical criterion for determining the optimal adjustment set among the minimal adjustment sets, which is valid for both linear and non-parametric estimators. We provide a new graphical criterion for comparing time dependent adjustment sets, that is, sets comprised by covariates that adjust for future treatments and that are themselves affected by earlier treatments. We show by example that uniformly optimal time dependent adjustment sets do not always exist. In addition, for point interventions, we provide a sound and complete graphical criterion for determining when a non-parametric optimally adjusted estimator of an interventional mean, or of a contrast of interventional means, is as efficient as an efficient estimator of the same parameter that exploits the information in the conditional independencies encoded in the non-parametric causal graphical model.
AI Key Findings
Get AI-generated insights about this paper's methodology, results, significance, and more — seven facets brought into focus.
Impact
Paper Details
PDF Preview
Key Terms
Citation Network
Current paper (gray), citations (green), references (blue)
Display is limited for performance on very large graphs.
Discussion 0