Publication
Metrics
AI Quick Summary
The paper proposes TACO, a framework for compressing large and complex formula graphs in spreadsheets, leveraging tabular locality to reduce querying and maintenance times. TACO achieves significant reductions in graph sizes and query speedups of up to 34,972x compared to a baseline and 632x compared to a commercial system.
Paper Preview
Abstract
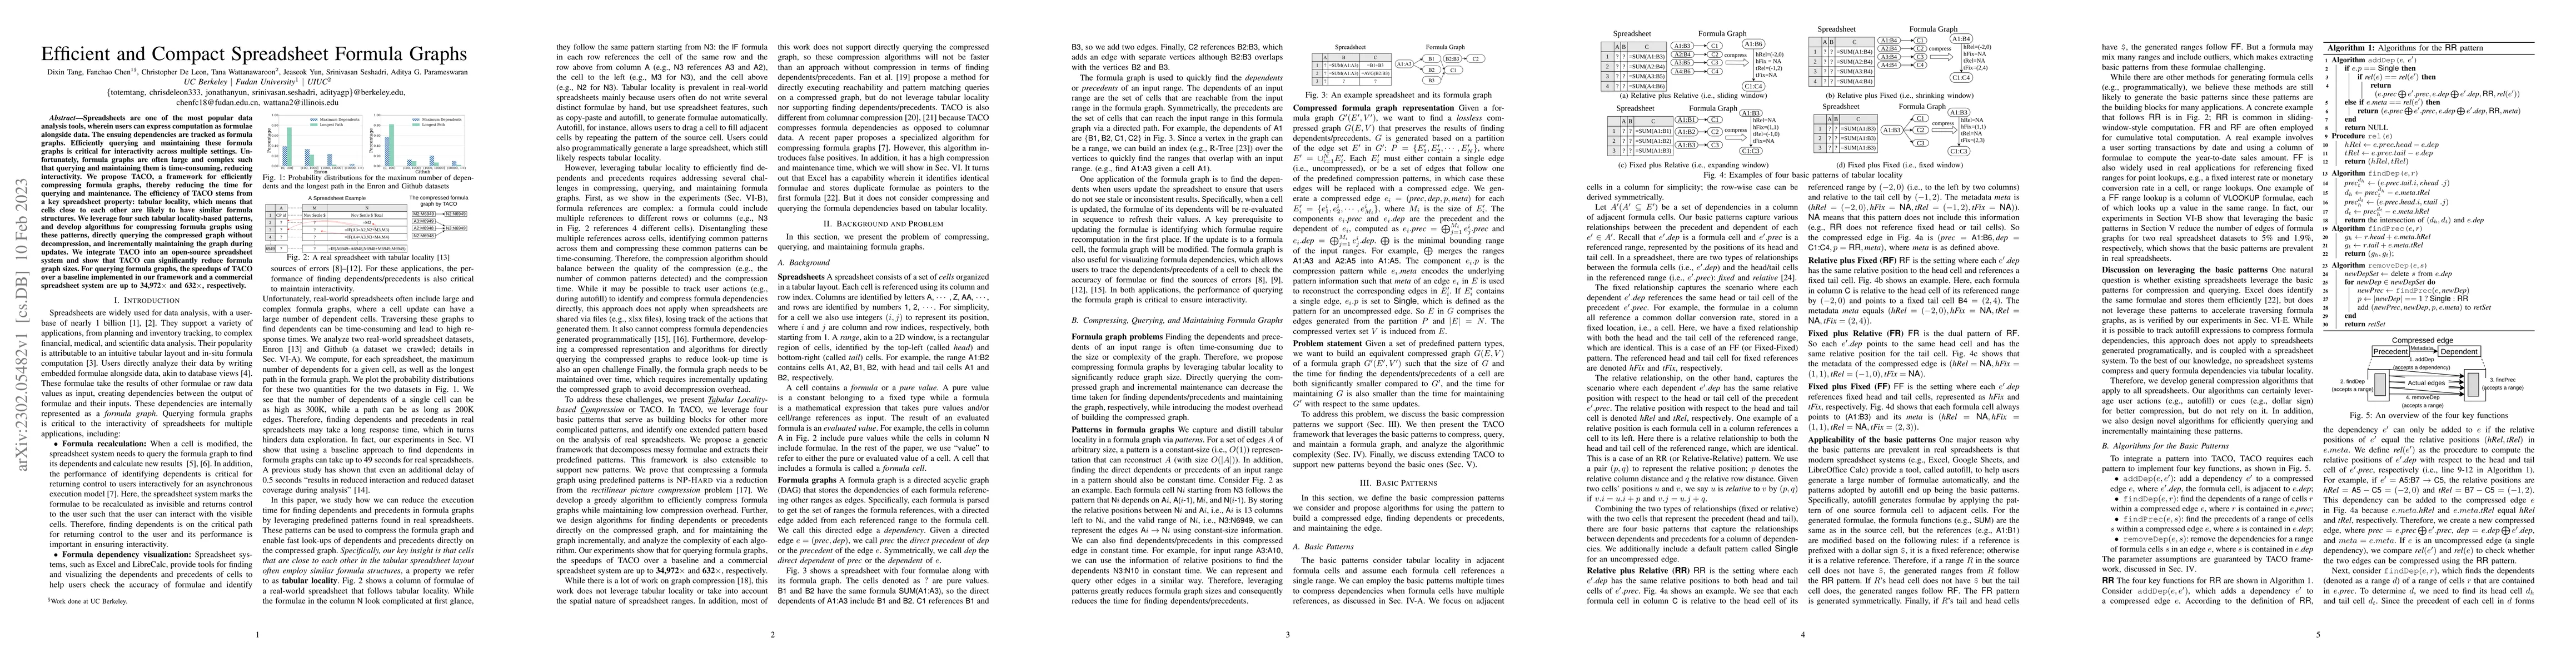
Spreadsheets are one of the most popular data analysis tools, wherein users can express computation as formulae alongside data. The ensuing dependencies are tracked as formula graphs. Efficiently querying and maintaining these formula graphs is critical for interactivity across multiple settings. Unfortunately, formula graphs are often large and complex such that querying and maintaining them is time-consuming, reducing interactivity. We propose TACO, a framework for efficiently compressing formula graphs, thereby reducing the time for querying and maintenance. The efficiency of TACO stems from a key spreadsheet property: tabular locality, which means that cells close to each other are likely to have similar formula structures. We leverage four such tabular locality-based patterns and develop algorithms for compressing formula graphs using these patterns, directly querying the compressed graph without decompression, and incrementally maintaining the graph during updates. We integrate TACO into an open-source spreadsheet system and show that TACO can significantly reduce formula graph sizes. For querying formula graphs, the speedups of TACO over a baseline implemented in our framework and a commercial spreadsheet system are up to 34,972x and 632x, respectively.
AI Key Findings
Get AI-generated insights about this paper's methodology, results, significance, and more — seven facets brought into focus.
Impact
Paper Details
Authors
PDF Preview
Key Terms
Citation Network
Current paper (gray), citations (green), references (blue)
Display is limited for performance on very large graphs.
Discussion 0