Publication
Metrics
Paper Preview
Abstract
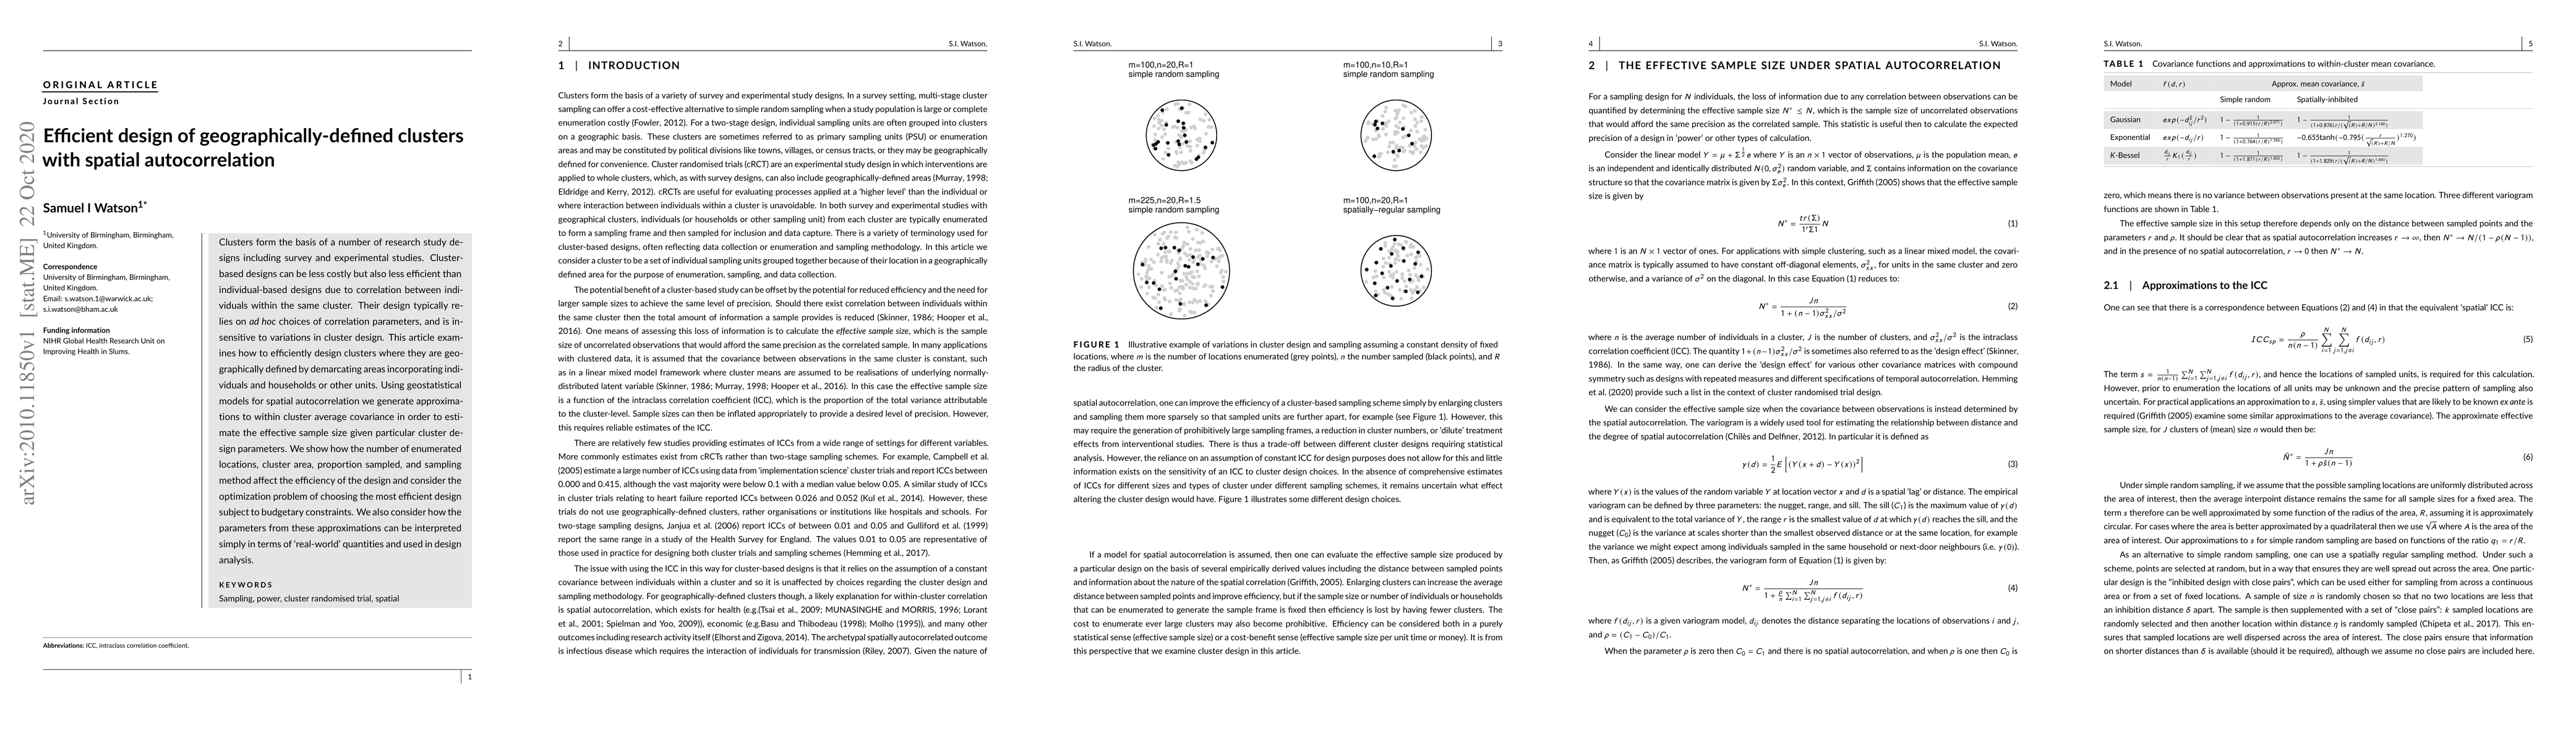
Clusters form the basis of a number of research study designs including survey and experimental studies. Cluster-based designs can be less costly but also less efficient than individual-based designs due to correlation between individuals within the same cluster. Their design typically relies on \textit{ad hoc} choices of correlation parameters, and is insensitive to variations in cluster design. This article examines how to efficiently design clusters where they are geographically defined by demarcating areas incorporating individuals and households or other units. Using geostatistical models for spatial autocorrelation we generate approximations to within cluster average covariance in order to estimate the effective sample size given particular cluster design parameters. We show how the number of enumerated locations, cluster area, proportion sampled, and sampling method affect the efficiency of the design and consider the optimization problem of choosing the most efficient design subject to budgetary constraints. We also consider how the parameters from these approximations can be interpreted simply in terms of `real-world' quantities and used in design analysis.
AI Key Findings
Get AI-generated insights about this paper's methodology, results, significance, and more — seven facets brought into focus.
Impact
Paper Details
Authors
PDF Preview
Key Terms
Citation Network
Current paper (gray), citations (green), references (blue)
Display is limited for performance on very large graphs.
Discussion 0