Efficient estimation of partially linear additive Cox models and variance estimation under shape restrictions
Publication
Metrics
AI Quick Summary
This paper develops a shape-restricted maximum partial likelihood estimator for additive partially linear Cox models with shape restrictions, proving its consistency, convergence rates, and asymptotic normality. It also introduces a versatile data-splitting method for variance estimation, demonstrating superior performance over traditional methods in simulations and real data analysis.
Paper Preview
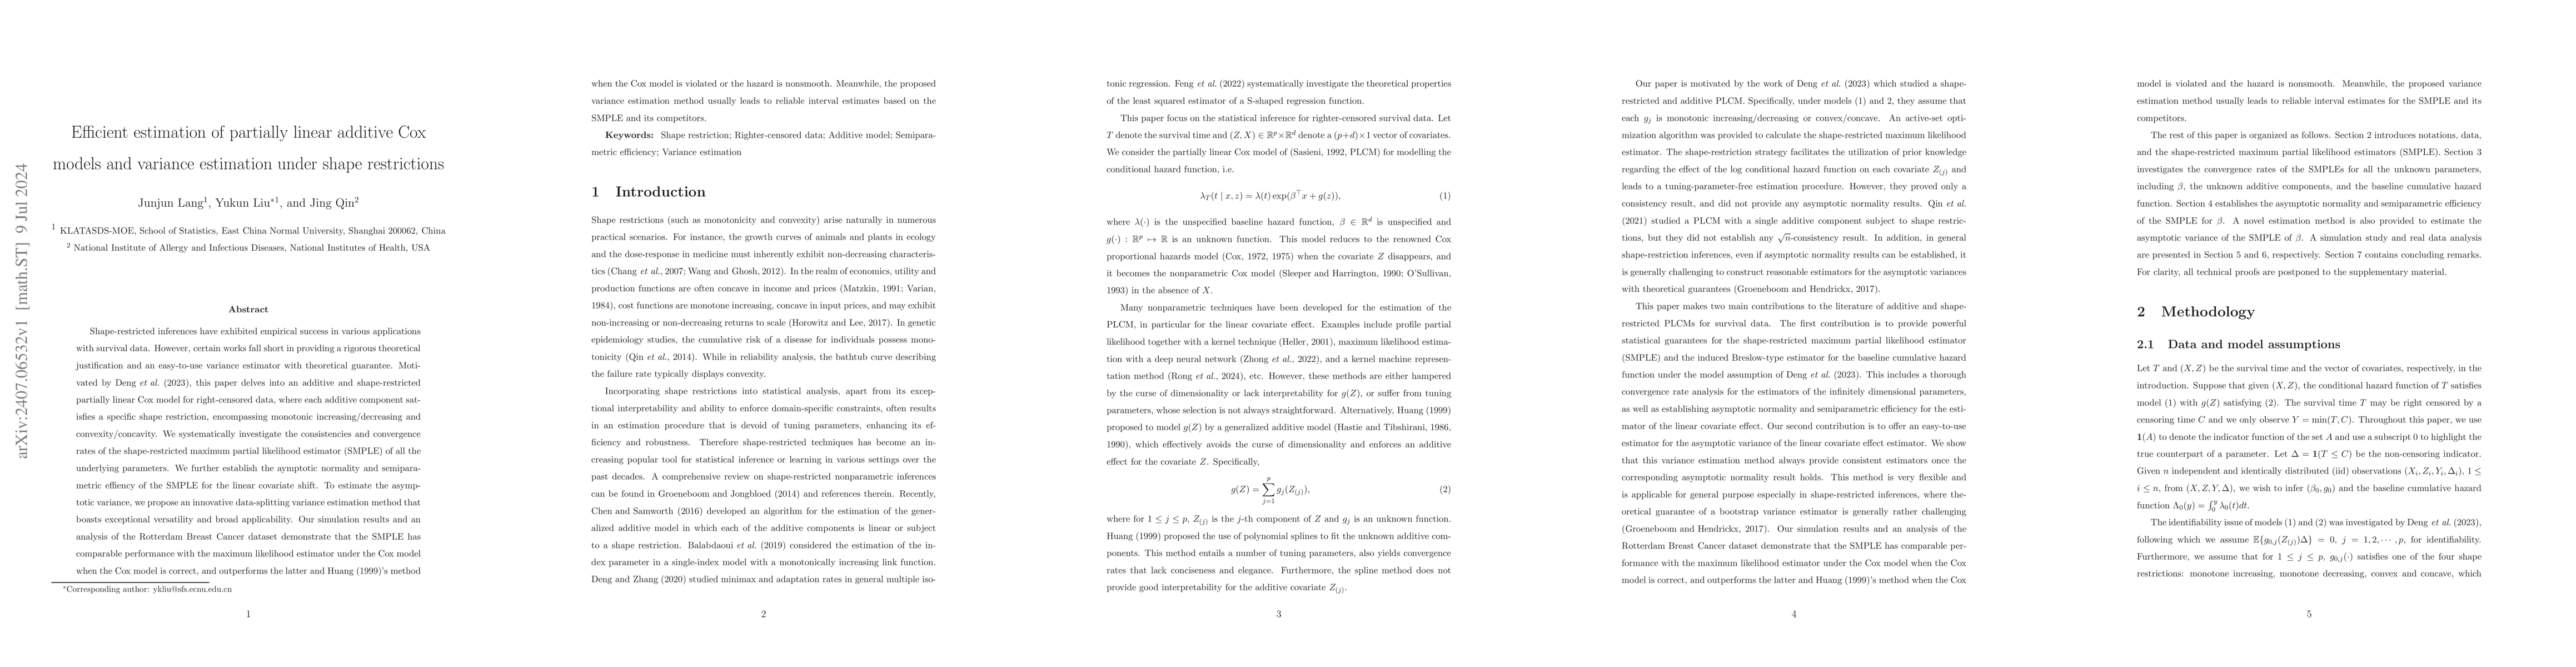
Abstract
Shape-restricted inferences have exhibited empirical success in various applications with survival data. However, certain works fall short in providing a rigorous theoretical justification and an easy-to-use variance estimator with theoretical guarantee. Motivated by Deng et al. (2023), this paper delves into an additive and shape-restricted partially linear Cox model for right-censored data, where each additive component satisfies a specific shape restriction, encompassing monotonic increasing/decreasing and convexity/concavity. We systematically investigate the consistencies and convergence rates of the shape-restricted maximum partial likelihood estimator (SMPLE) of all the underlying parameters. We further establish the aymptotic normality and semiparametric effiency of the SMPLE for the linear covariate shift. To estimate the asymptotic variance, we propose an innovative data-splitting variance estimation method that boasts exceptional versatility and broad applicability. Our simulation results and an analysis of the Rotterdam Breast Cancer dataset demonstrate that the SMPLE has comparable performance with the maximum likelihood estimator under the Cox model when the Cox model is correct, and outperforms the latter and Huang (1999)'s method when the Cox model is violated or the hazard is nonsmooth. Meanwhile, the proposed variance estimation method usually leads to reliable interval estimates based on the SMPLE and its competitors.
AI Key Findings
Get AI-generated insights about this paper's methodology, results, significance, and more — seven facets brought into focus.
Impact
Authors
PDF Preview
Citation Network
Current paper (gray), citations (green), references (blue)
Display is limited for performance on very large graphs.
Discussion 0