Publication
Metrics
AI Quick Summary
This paper demonstrates that the distribution of activity durations and total floats in construction project schedules follows a power law scaling, essential for estimating project delay distributions. It explains the scaling of activity durations through historical specialization, while the total floats' scaling is network-dependent, providing new insights for project delay risk analysis and forecasting.
Paper Preview
Abstract
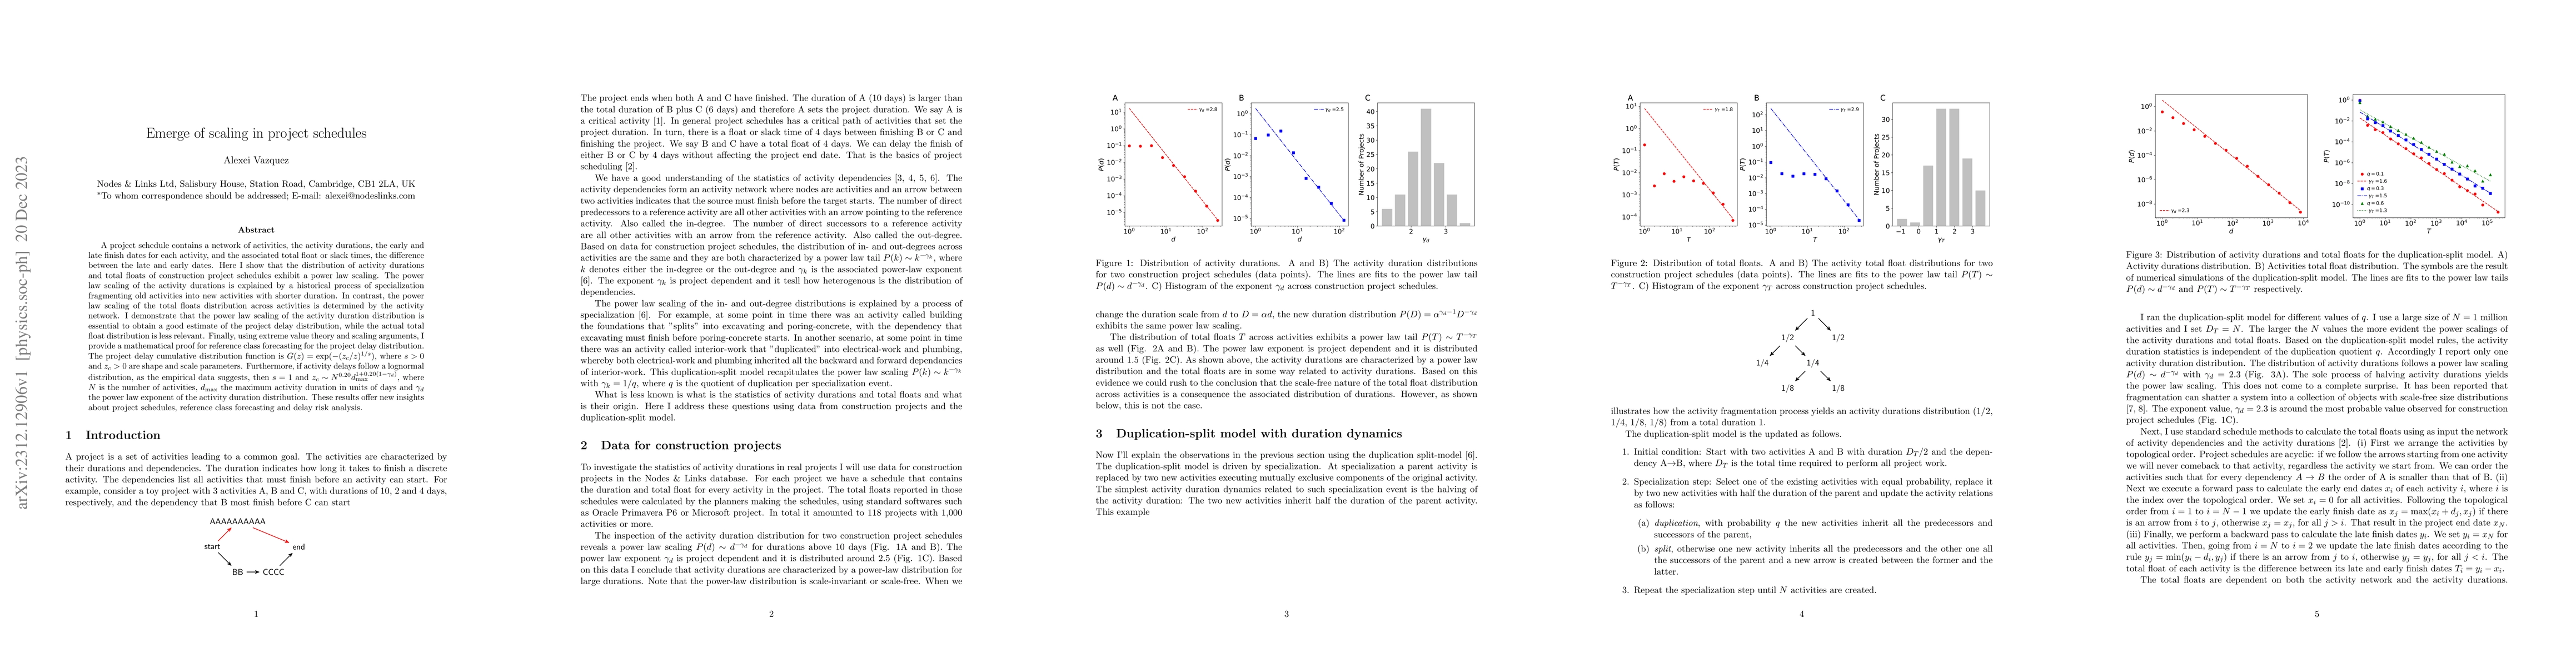
A project schedule contains a network of activities, the activity durations, the early and late finish dates for each activity, and the associated total float or slack times, the difference between the late and early dates. Here I show that the distribution of activity durations and total floats of construction project schedules exhibit a power law scaling. The power law scaling of the activity durations is explained by a historical process of specialization fragmenting old activities into new activities with shorter duration. In contrast, the power law scaling of the total floats distribution across activities is determined by the activity network. I demonstrate that the power law scaling of the activity duration distribution is essential to obtain a good estimate of the project delay distribution, while the actual total float distribution is less relevant. Finally, using extreme value theory and scaling arguments, I provide a mathematical proof for reference class forecasting for the project delay distribution. The project delay cumulative distribution function is $G(z) = \exp( - (z_c/z)^{1/s})$, where $s>0$ and $z_c>0$ are shape and scale parameters. Furthermore, if activity delays follow a lognormal distribution, as the empirical data suggests, then $s=1$ and $z_c \sim N^{0.20}d_{\max}^{1+0.20(1-\gamma_d)}$, where $N$ is the number of activities, $d_{\max}$ the maximum activity duration in units of days and $\gamma_d$ the power law exponent of the activity duration distribution. These results offer new insights about project schedules, reference class forecasting and delay risk analysis.
AI Key Findings
Get AI-generated insights about this paper's methodology, results, significance, and more — seven facets brought into focus.
Impact
Paper Details
Authors
PDF Preview
Key Terms
Citation Network
Current paper (gray), citations (green), references (blue)
Display is limited for performance on very large graphs.
Discussion 0