Emerging Polynomial Growth Trends in COVID-19 Pandemic Data and Their Reconciliation with Compartment Based Models
Publication
Metrics
AI Quick Summary
This paper analyzes COVID-19 data from January to May 2020 in 119 countries, finding that active cases follow polynomial growth trends, transitioning to polynomial growth with exponential decay in later stages. The findings reconcile with compartment-based epidemic models, suggesting an algebraic decay of the relative reproduction number.
Paper Preview
Abstract
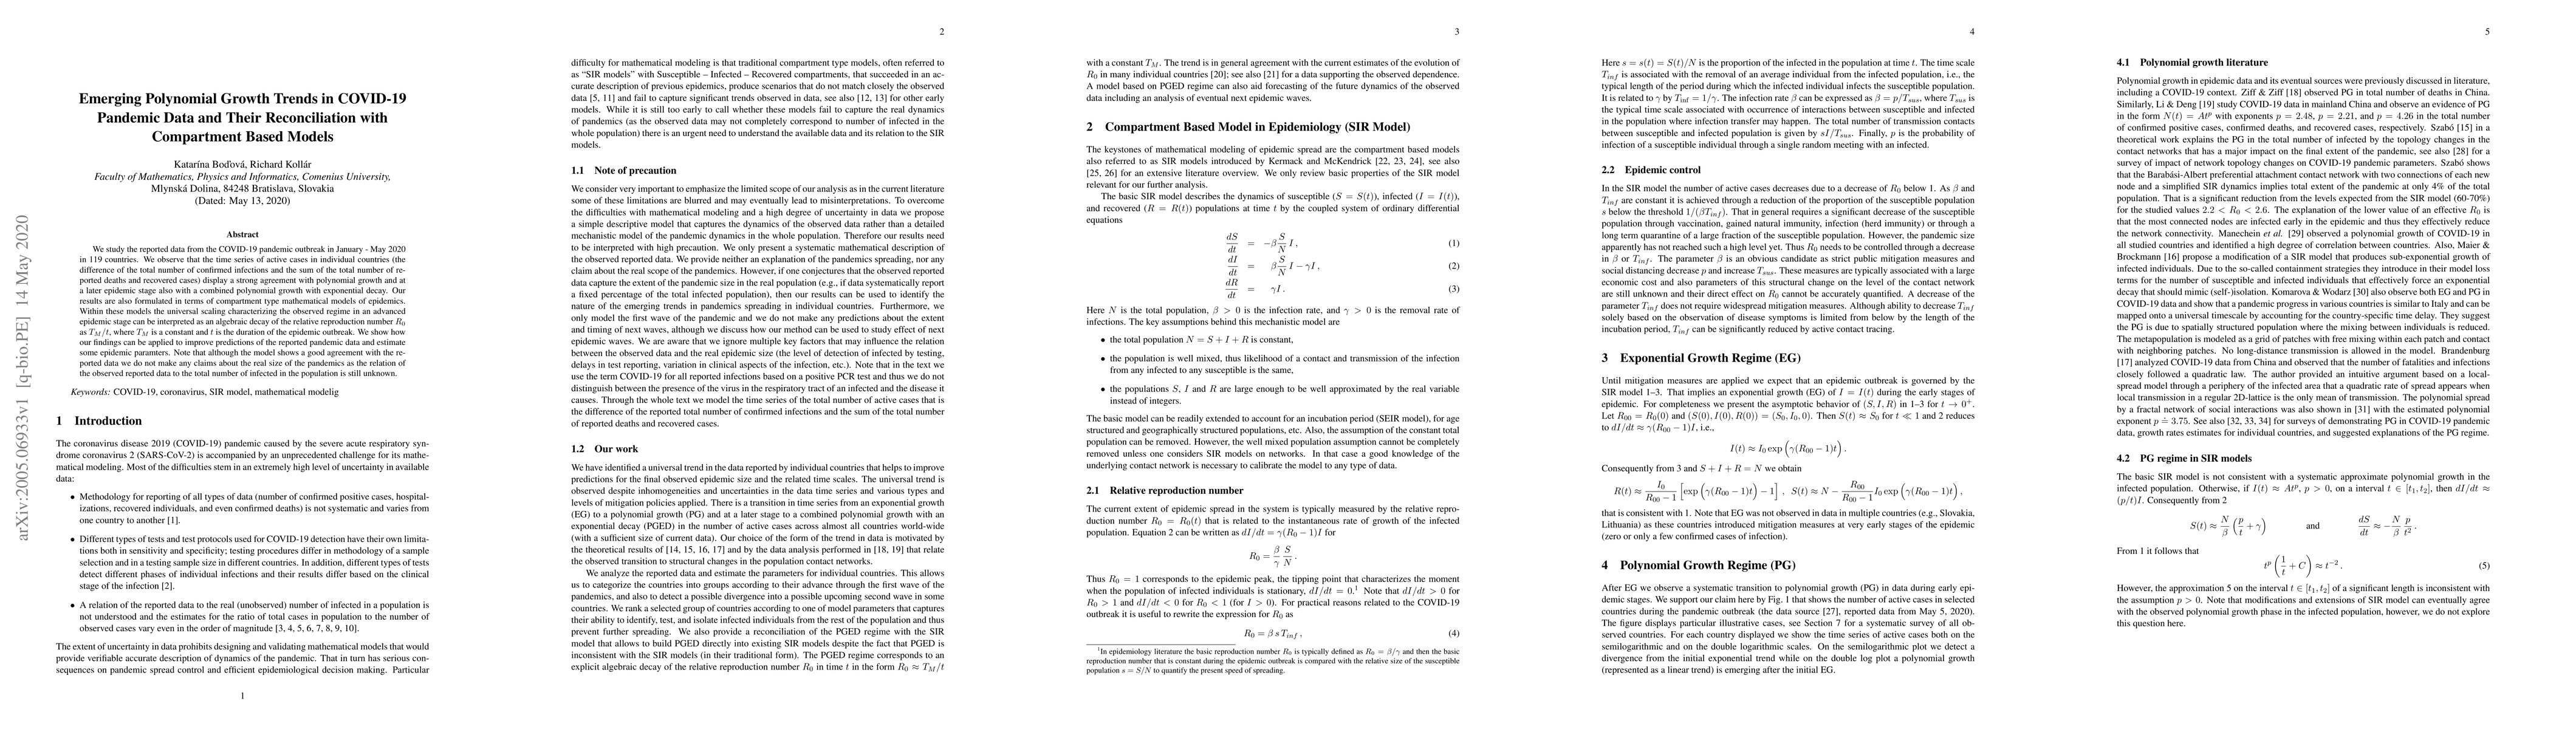
We study the reported data from the COVID-19 pandemic outbreak in January - May 2020 in 119 countries. We observe that the time series of active cases in individual countries (the difference of the total number of confirmed infections and the sum of the total number of reported deaths and recovered cases) display a strong agreement with polynomial growth and at a later epidemic stage also with a combined polynomial growth with exponential decay. Our results are also formulated in terms of compartment type mathematical models of epidemics. Within these models the universal scaling characterizing the observed regime in an advanced epidemic stage can be interpreted as an algebraic decay of the relative reproduction number $R_0$ as $T_M/t$, where $T_M$ is a constant and $t$ is the duration of the epidemic outbreak. We show how our findings can be applied to improve predictions of the reported pandemic data and estimate some epidemic parameters. Note that although the model shows a good agreement with the reported data we do not make any claims about the real size of the pandemics as the relation of the observed reported data to the total number of infected in the population is still unknown.
AI Key Findings
Get AI-generated insights about this paper's methodology, results, significance, and more — seven facets brought into focus.
Impact
Paper Details
Authors
PDF Preview
Key Terms
Citation Network
Current paper (gray), citations (green), references (blue)
Display is limited for performance on very large graphs.
Discussion 0