Empirical Bayes Covariance Decomposition, and a solution to the Multiple Tuning Problem in Sparse PCA
Publication
Metrics
AI Quick Summary
This paper presents an Empirical Bayes method for solving the multiple tuning problem in sparse PCA, introducing a general penalized PCA formulation that leads to an efficient covariance decomposition. The empirical Bayes approach determines penalties from data-estimated priors, providing a principled solution extendable to other structural assumptions.
Paper Preview
Abstract
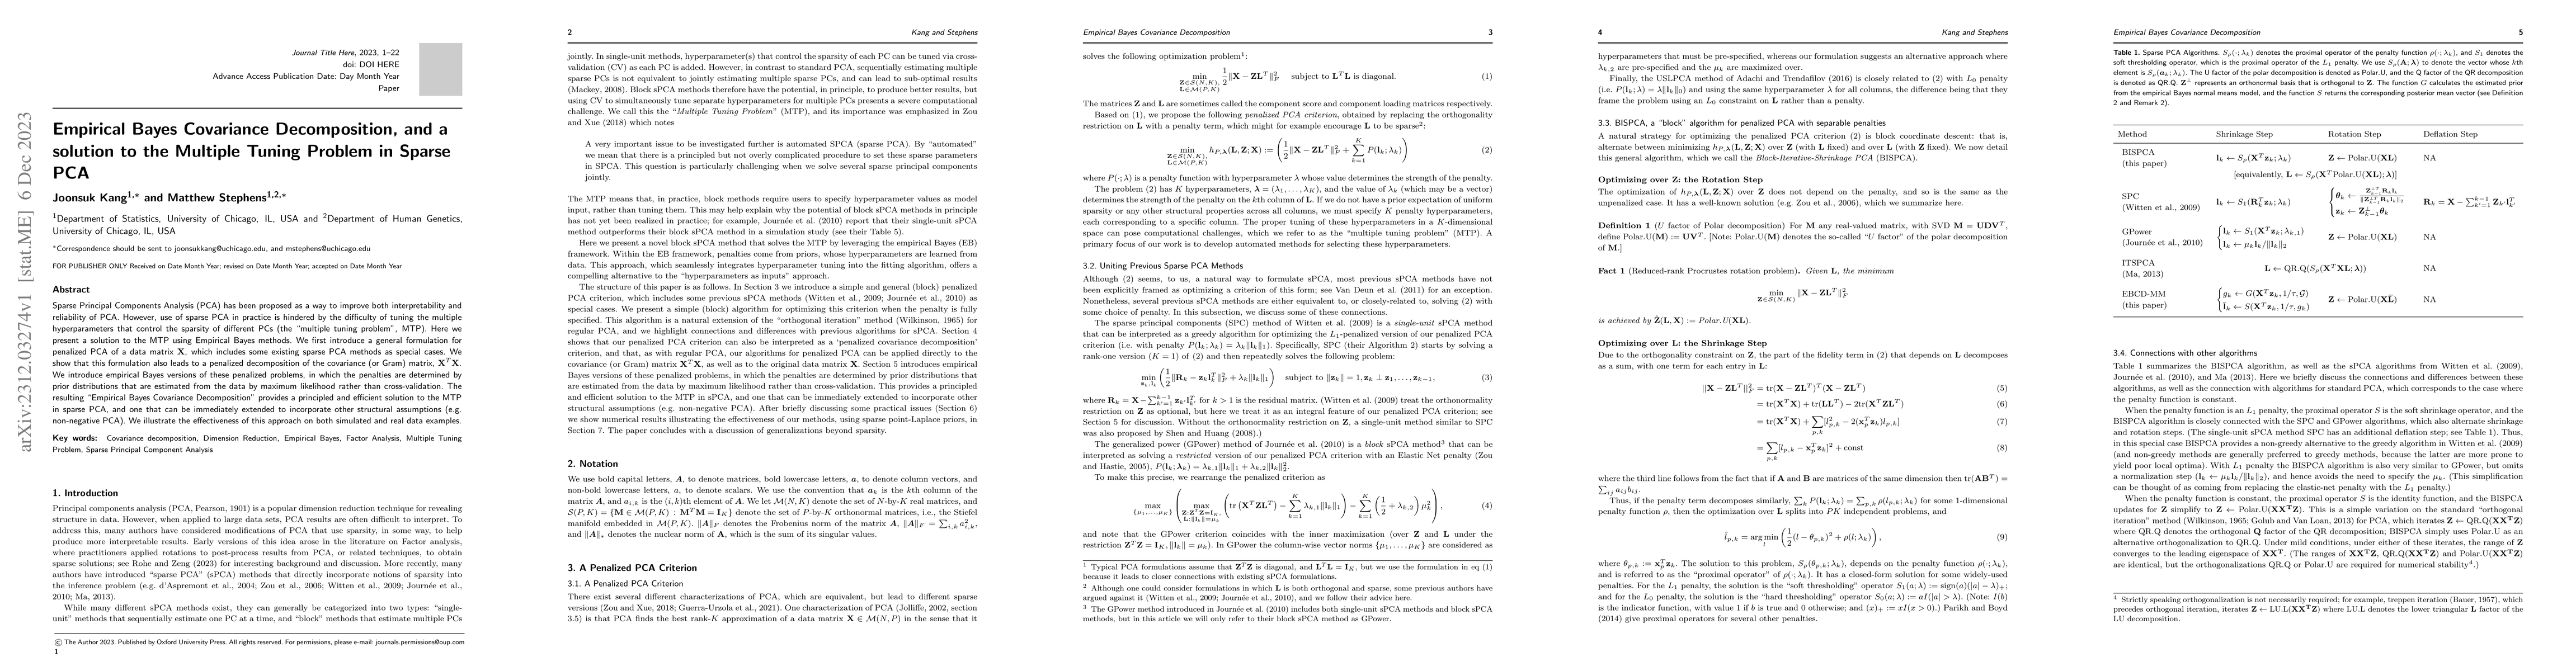
Sparse Principal Components Analysis (PCA) has been proposed as a way to improve both interpretability and reliability of PCA. However, use of sparse PCA in practice is hindered by the difficulty of tuning the multiple hyperparameters that control the sparsity of different PCs (the "multiple tuning problem", MTP). Here we present a solution to the MTP using Empirical Bayes methods. We first introduce a general formulation for penalized PCA of a data matrix $\mathbf{X}$, which includes some existing sparse PCA methods as special cases. We show that this formulation also leads to a penalized decomposition of the covariance (or Gram) matrix, $\mathbf{X}^T\mathbf{X}$. We introduce empirical Bayes versions of these penalized problems, in which the penalties are determined by prior distributions that are estimated from the data by maximum likelihood rather than cross-validation. The resulting "Empirical Bayes Covariance Decomposition" provides a principled and efficient solution to the MTP in sparse PCA, and one that can be immediately extended to incorporate other structural assumptions (e.g. non-negative PCA). We illustrate the effectiveness of this approach on both simulated and real data examples.
AI Key Findings — Failed
Key findings generation failed. Failed to start generation process
Impact
Paper Details
Authors
PDF Preview
Key Terms
Citation Network
Current paper (gray), citations (green), references (blue)
Display is limited for performance on very large graphs.
Discussion 0