Emulator-based Decomposition for Structural Sensitivity of Core-level Spectra
Publication
Metrics
AI Quick Summary
Researchers developed a method to analyze how changes in an atom's structure affect its core-level spectroscopic signals, identifying 'spectroscopically dominant degrees of freedom' that capture the most significant spectral variations.
Paper Preview
Abstract
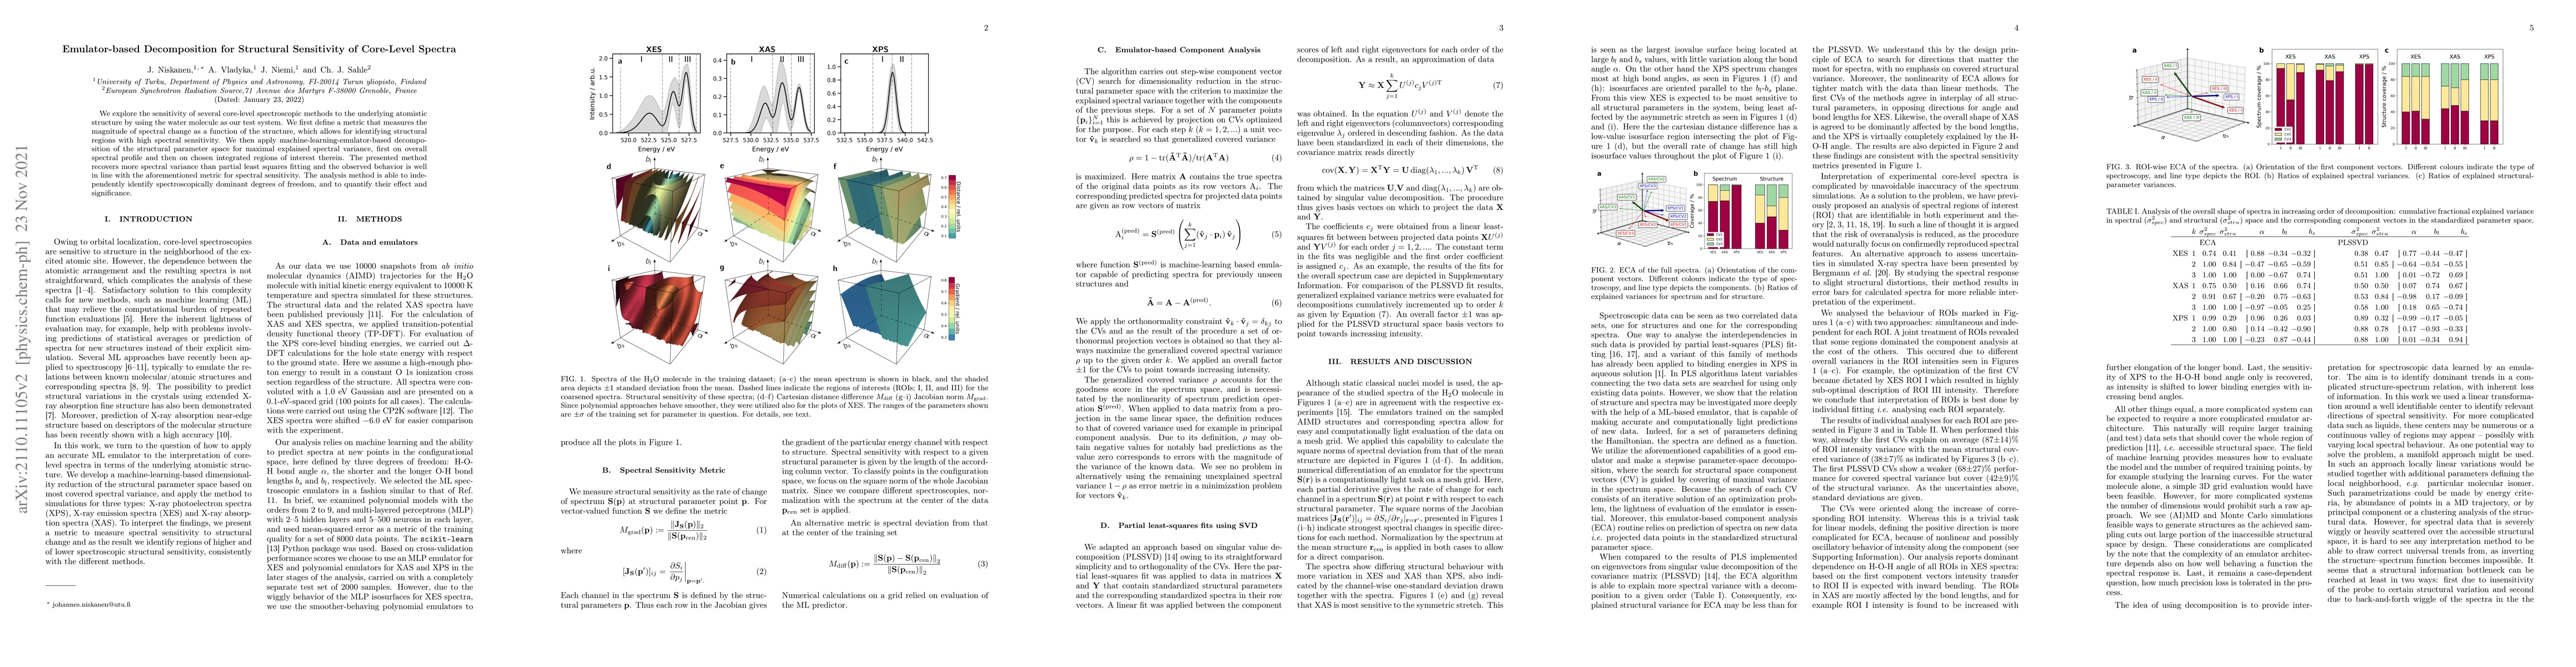
We explore the sensitivity of several core-level spectroscopic methods to the underlying atomistic structure by using the water molecule as our test system. We first define a metric that measures the magnitude of spectral change as a function of the structure, which allows for identifying structural regions with high spectral sensitivity. We then apply machine-learning-emulator-based decomposition of the structural parameter space for maximal explained spectral variance, first on overall spectral profile and then on chosen integrated regions of interest therein. The presented method recovers more spectral variance than partial least squares fitting and the observed behavior is well in line with the aforementioned metric for spectral sensitivity. The analysis method is able to independently identify spectroscopically dominant degrees of freedom, and to quantify their effect and significance.
AI Key Findings
Get AI-generated insights about this paper's methodology, results, significance, and more — seven facets brought into focus.
Impact
Paper Details
Authors
PDF Preview
Key Terms
Citation Network
Current paper (gray), citations (green), references (blue)
Display is limited for performance on very large graphs.
Discussion 0