Publication
Metrics
AI Quick Summary
This paper explores the application of visual analytics to longitudinal clinical data from 998 COVID-19 patients, detailing data transformation, initial findings, and qualitative feedback to support future improvements. Key features and limitations are identified to enhance exploratory analysis of COVID-19 data.
Paper Preview
Abstract
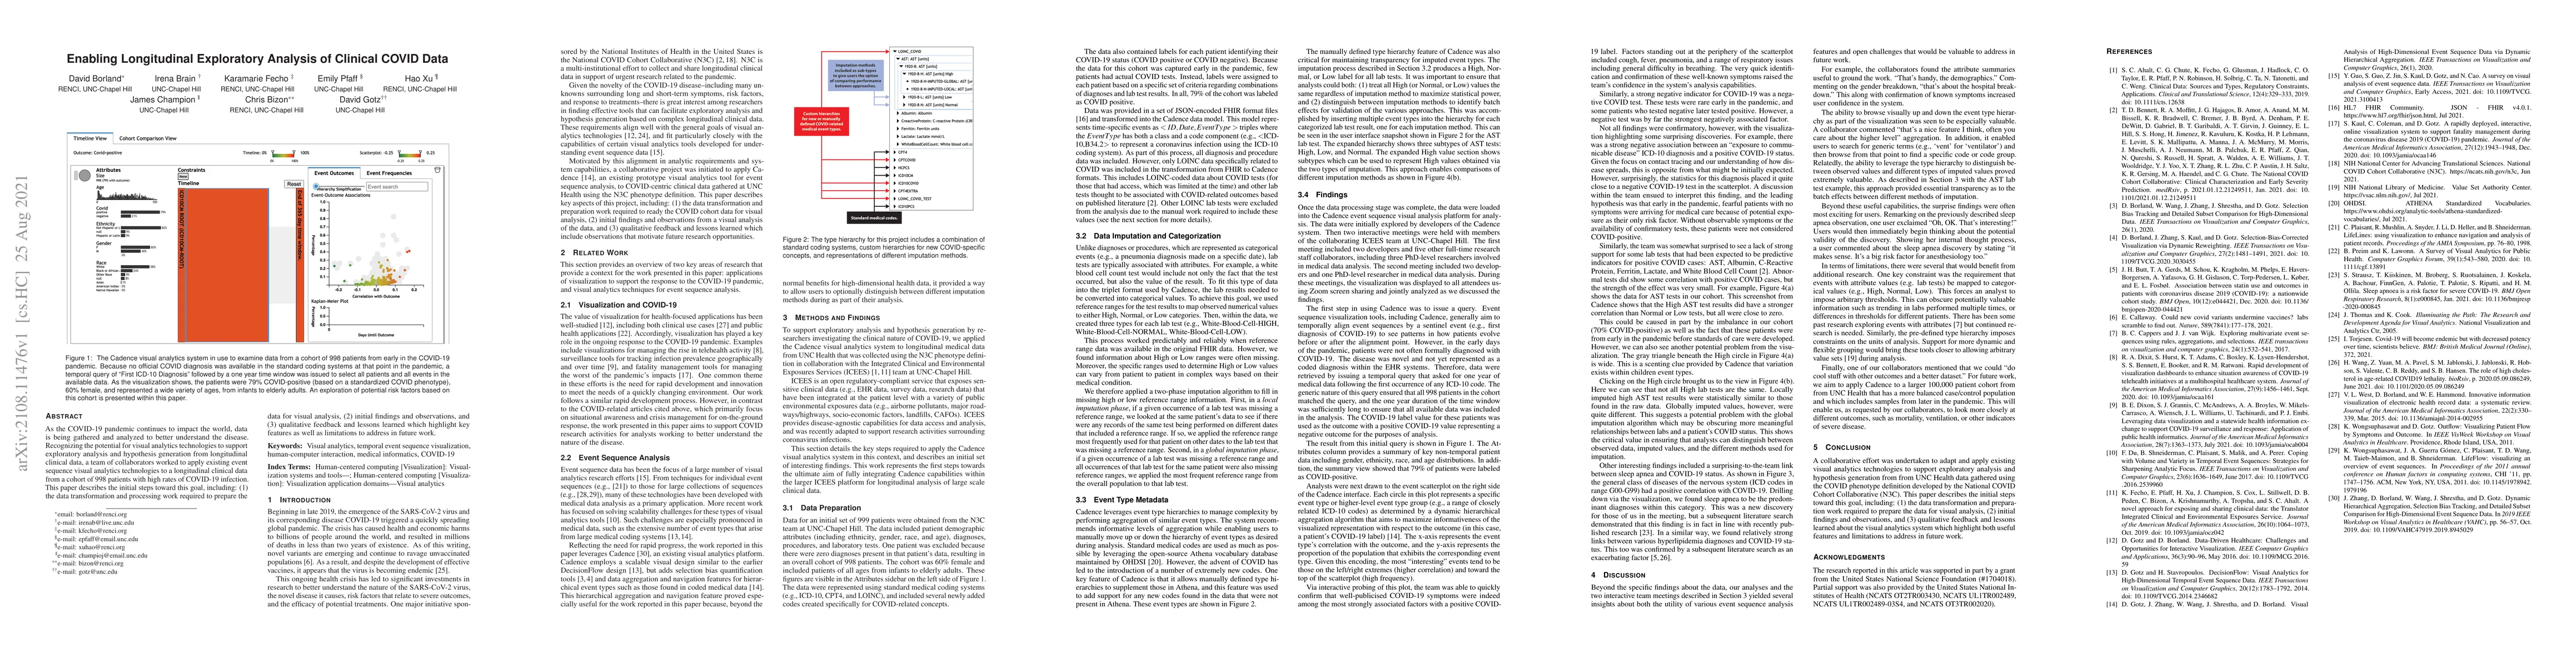
As the COVID-19 pandemic continues to impact the world, data is being gathered and analyzed to better understand the disease. Recognizing the potential for visual analytics technologies to support exploratory analysis and hypothesis generation from longitudinal clinical data, a team of collaborators worked to apply existing event sequence visual analytics technologies to a longitudinal clinical data from a cohort of 998 patients with high rates of COVID-19 infection. This paper describes the initial steps toward this goal, including: (1) the data transformation and processing work required to prepare the data for visual analysis, (2) initial findings and observations, and (3) qualitative feedback and lessons learned which highlight key features as well as limitations to address in future work.
AI Key Findings
Get AI-generated insights about this paper's methodology, results, significance, and more — seven facets brought into focus.
Impact
Paper Details
Authors
PDF Preview
Key Terms
Citation Network
Current paper (gray), citations (green), references (blue)
Display is limited for performance on very large graphs.
Discussion 0