Summary
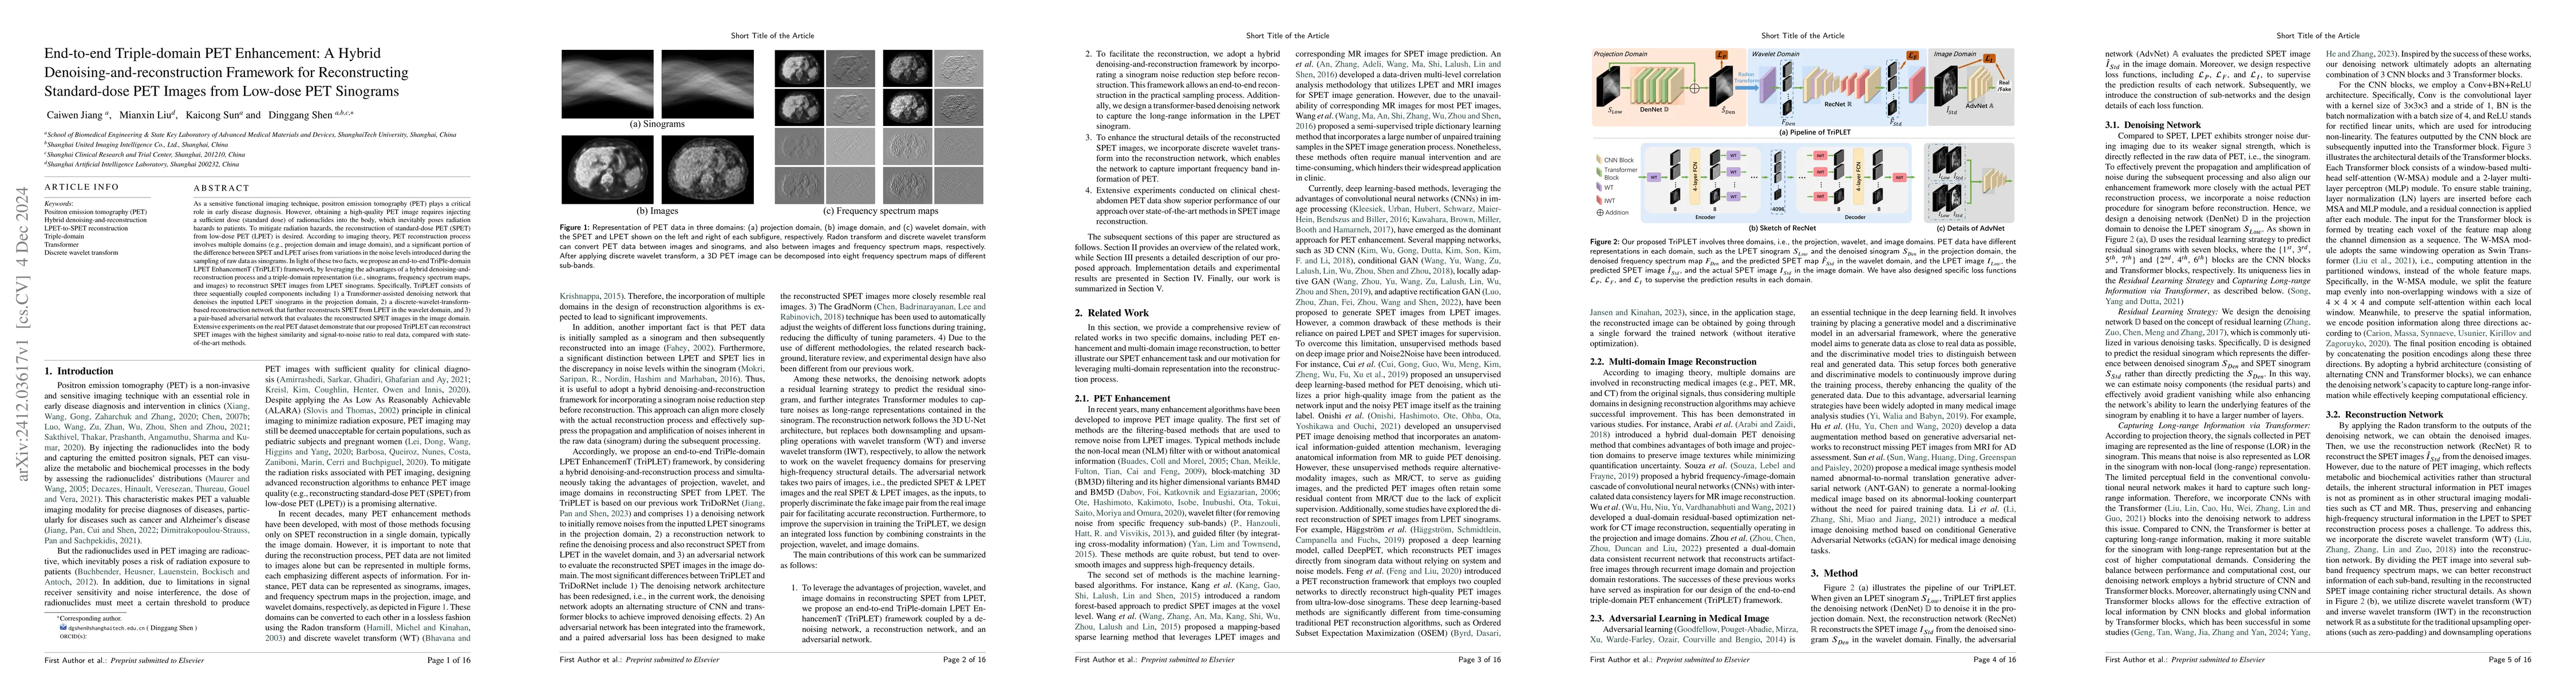
As a sensitive functional imaging technique, positron emission tomography (PET) plays a critical role in early disease diagnosis. However, obtaining a high-quality PET image requires injecting a sufficient dose (standard dose) of radionuclides into the body, which inevitably poses radiation hazards to patients. To mitigate radiation hazards, the reconstruction of standard-dose PET (SPET) from low-dose PET (LPET) is desired. According to imaging theory, PET reconstruction process involves multiple domains (e.g., projection domain and image domain), and a significant portion of the difference between SPET and LPET arises from variations in the noise levels introduced during the sampling of raw data as sinograms. In light of these two facts, we propose an end-to-end TriPle-domain LPET EnhancemenT (TriPLET) framework, by leveraging the advantages of a hybrid denoising-and-reconstruction process and a triple-domain representation (i.e., sinograms, frequency spectrum maps, and images) to reconstruct SPET images from LPET sinograms. Specifically, TriPLET consists of three sequentially coupled components including 1) a Transformer-assisted denoising network that denoises the inputted LPET sinograms in the projection domain, 2) a discrete-wavelet-transform-based reconstruction network that further reconstructs SPET from LPET in the wavelet domain, and 3) a pair-based adversarial network that evaluates the reconstructed SPET images in the image domain. Extensive experiments on the real PET dataset demonstrate that our proposed TriPLET can reconstruct SPET images with the highest similarity and signal-to-noise ratio to real data, compared with state-of-the-art methods.
AI Key Findings
Get AI-generated insights about this paper's methodology, results, and significance.
Paper Details
PDF Preview
Citation Network
Current paper (gray), citations (green), references (blue)
Display is limited for performance on very large graphs.
Similar Papers
Found 4 papersTriDo-Former: A Triple-Domain Transformer for Direct PET Reconstruction from Low-Dose Sinograms
Peng Wang, Dinggang Shen, Jiaqi Cui et al.
Does prior knowledge in the form of multiple low-dose PET images (at different dose levels) improve standard-dose PET prediction?
Hossein Arabi, Behnoush Sanaei, Reza Faghihi
Full-dose Whole-body PET Synthesis from Low-dose PET Using High-efficiency Denoising Diffusion Probabilistic Model: PET Consistency Model
Shaoyan Pan, Xiaofeng Yang, Junbo Peng et al.
A resource-efficient deep learning framework for low-dose brain PET image reconstruction and analysis
Feng Li, Cheng Zhuo, Yi Liao et al.
No citations found for this paper.
Comments (0)