Background
Influence diagrams offer a natural representation for Bayesian statistical models, but their interpretation and manipulation are challenging for end users who lack deep training in probabilistic modeling. The paper proposes a user based UB architecture that enables end users to construct and alter the knowledge representation through domain friendly metaphors. In the TAPRCT setting, elements of statistical models are encoded as subgraphs within a restricted class of influence diagrams, and the user interface translates these elements into the domain language via a patient-flow diagram. A metadata-state diagram, called the cohort-state diagram, mediates user driven modifications to ensure that semantic relationships and methodological constraints are preserved. The THOMAS system embodies this architecture and is used to illustrate how physicians interpret trial reports through the lens of the model.
Problem / Research Question
The central challenge is enabling end users to actively participate in constructing and updating Bayesian models without requiring them to master complex probabilistic formalisms. The research asks whether a semantically grounded, user friendly interface can support dynamic, valid modifications to influence diagrams while maintaining interpretability and methodological fidelity. It also asks how to encode domain knowledge so that user actions produce meaningful, semantically consistent changes to both the patient level representations and the underlying statistical model.
Innovation / Contribution
The paper makes several novel contributions. First, it introduces a user oriented architecture that couples a domain specific semantic interface with a formal probabilistic model through two complementary diagrams: the patient-flow diagram and the cohort-state diagram. Second, it defines construction steps as modular actions that transform the statistical model and the user interface in a coordinated way, enabling dynamic, user driven model construction. Third, it demonstrates a concrete implementation in THOMAS for TAPRCT problems, showing how withdrawals and other methodological concerns can be represented as well defined model transformations. Fourth, it restricts the influence diagram class to a practical, beta distributed, layer of marginally independent chance nodes, balancing expressiveness with tractability for end users. Finally, it points to broader implications by suggesting that similar meta level control and semantic grounding could generalize to other AI domains beyond clinical trials.
Methodology / Approach
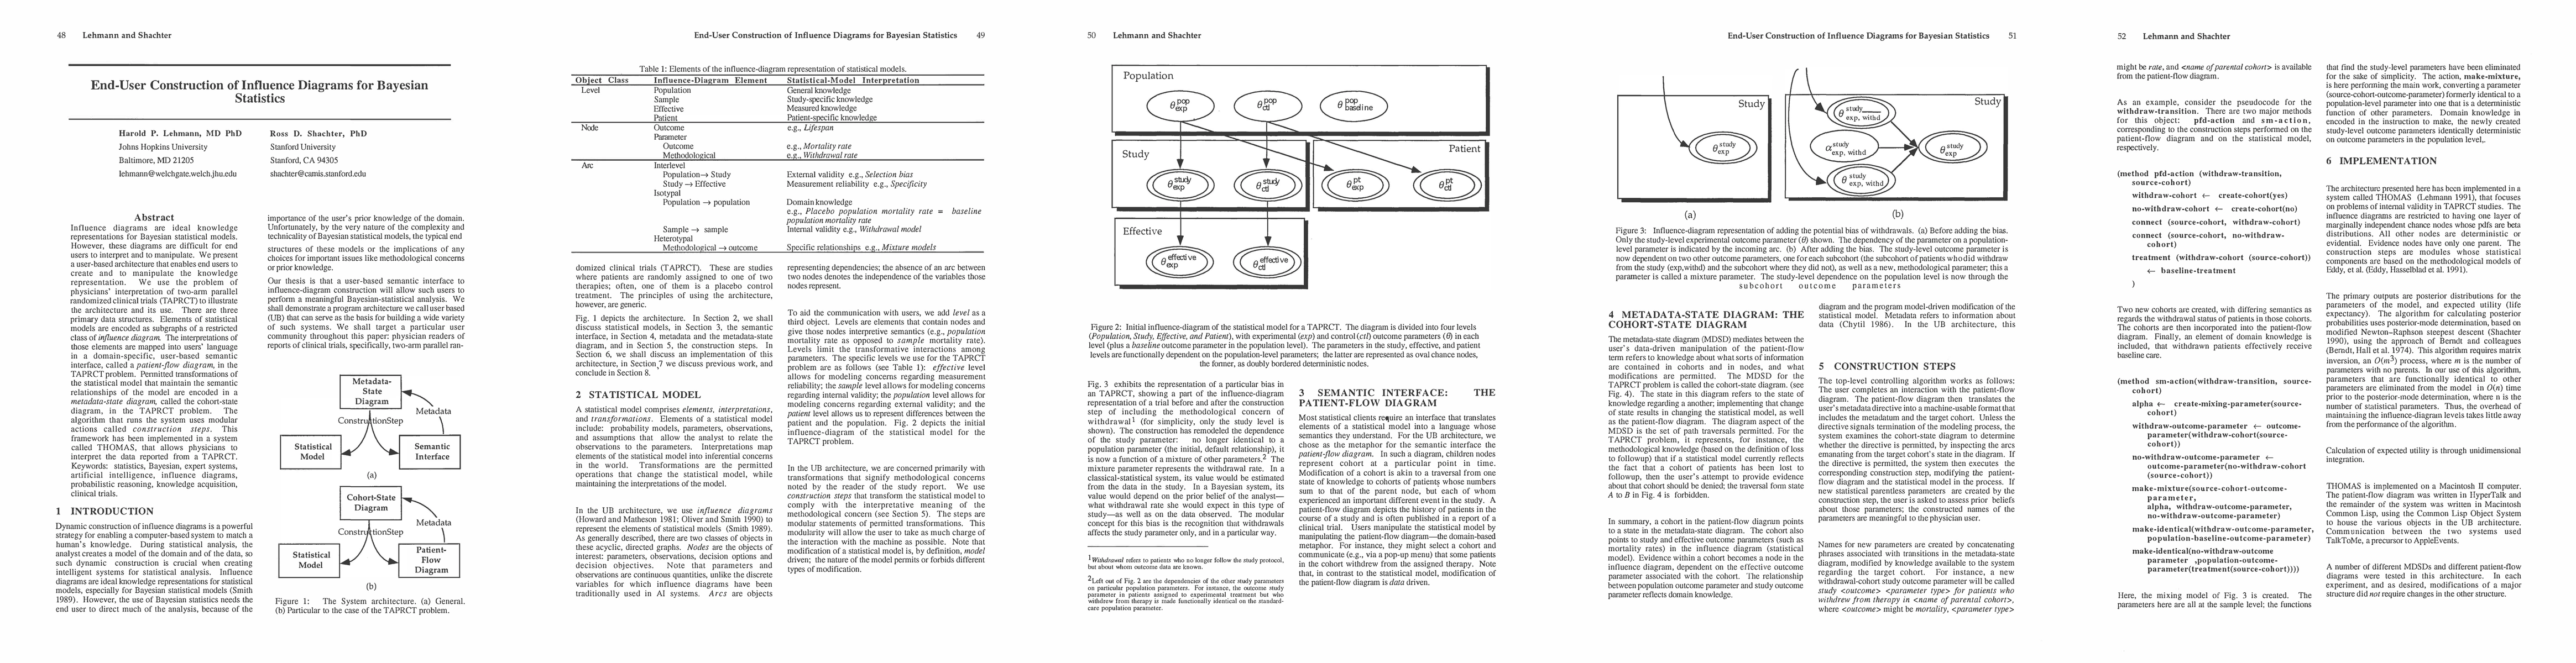
The statistical model is organized as a four level graph: Population, Study, Effective, and Patient. Nodes are either deterministic or probabilistic, with arcs encoding dependencies. To aid communication with users, a third object level, the concept of a cohort, is used to represent cohort state across time, enabling intuitive interpretation of changes in knowledge. Users manipulate the model through a patient-flow diagram that captures the history and transitions of patient cohorts during the trial. The cohort-state diagram (MDSD) encodes which transformations are allowed, ensuring that user actions do not violate semantic constraints such as the interpretation of withdrawal or loss to follow-up.
Transformations are implemented as construction steps, of two types: pfd-action and sm-action. The pfd-action updates the patient-flow diagram, while the sm-action updates the statistical model. A critical example is a withdrawal transition where a mixing parameter alpha is introduced to model the withdrawal outcome as a mixture of the withdrawn and non-withdrawn paths, and where certain outcome parameters are made identical to population baselines or treated as conditional on the cohort. The process begins with user interaction, followed by a check against the MDSD, and then the execution of the corresponding construction step, after which new parameters are named by combining phase labels with cohort identifiers.
Experiments / Evaluation
The authors describe a design based on a TAPRCT problem and implement the architecture in THOMAS, a system designed to focus on internal validity concerns of two arm trials. The influence diagrams used are restricted to a single layer of beta distributed marginally independent chance nodes, and the posterior probabilities are computed via posterior mode determination using a modified Newton-Raphson method. The evaluation appears to be architectural and usability oriented, illustrating how a clinician would interact with the patient-flow diagram, how the MDSD constrains actions, and how a transform step updates the model and its semantics. The narrative notes that users found the patient-flow diagram to be self-evident, underscoring the usability goal of the semantic interface. There is no report of large scale quantitative benchmarks in the excerpt.
Key Results
The architecture demonstrates that end users can meaningfully participate in Bayesian model construction without becoming statisticians. By separating semantic interpretation (via patient-flow) from statistical structure (via influence diagrams) and by governing transformations with the cohort-state diagram, the system preserves critical causal and methodological relationships while enabling iterative model refinement. The THOMAS implementation provides a concrete proof of concept showing how a clinician could interpret trial data and adjust the analysis within a principled framework, including how to handle common concerns like withdrawals through explicit, domain informed transformations. The approach also highlights a pathway for extending end user oriented Bayesian tools beyond the TAPRCT domain.
Practical Applications
In clinical research and practice, the UB architecture enables physicians and other domain experts to engage directly with the statistical modeling process, improving interpretability and trust in Bayesian inferences drawn from trial data. The domain specific, user oriented semantic interface lowers the technical barrier to Bayesian reasoning while preserving methodological rigor through the MDSD constraints. Beyond TAPRCT, the same architectural blueprint could be adapted to other domains where end users must reason about complex probabilistic models without deep statistical training, potentially informing tools for medical decision making, risk assessment, or other areas of AI assisted evidence synthesis.
Discussion 0