Authors
Summary
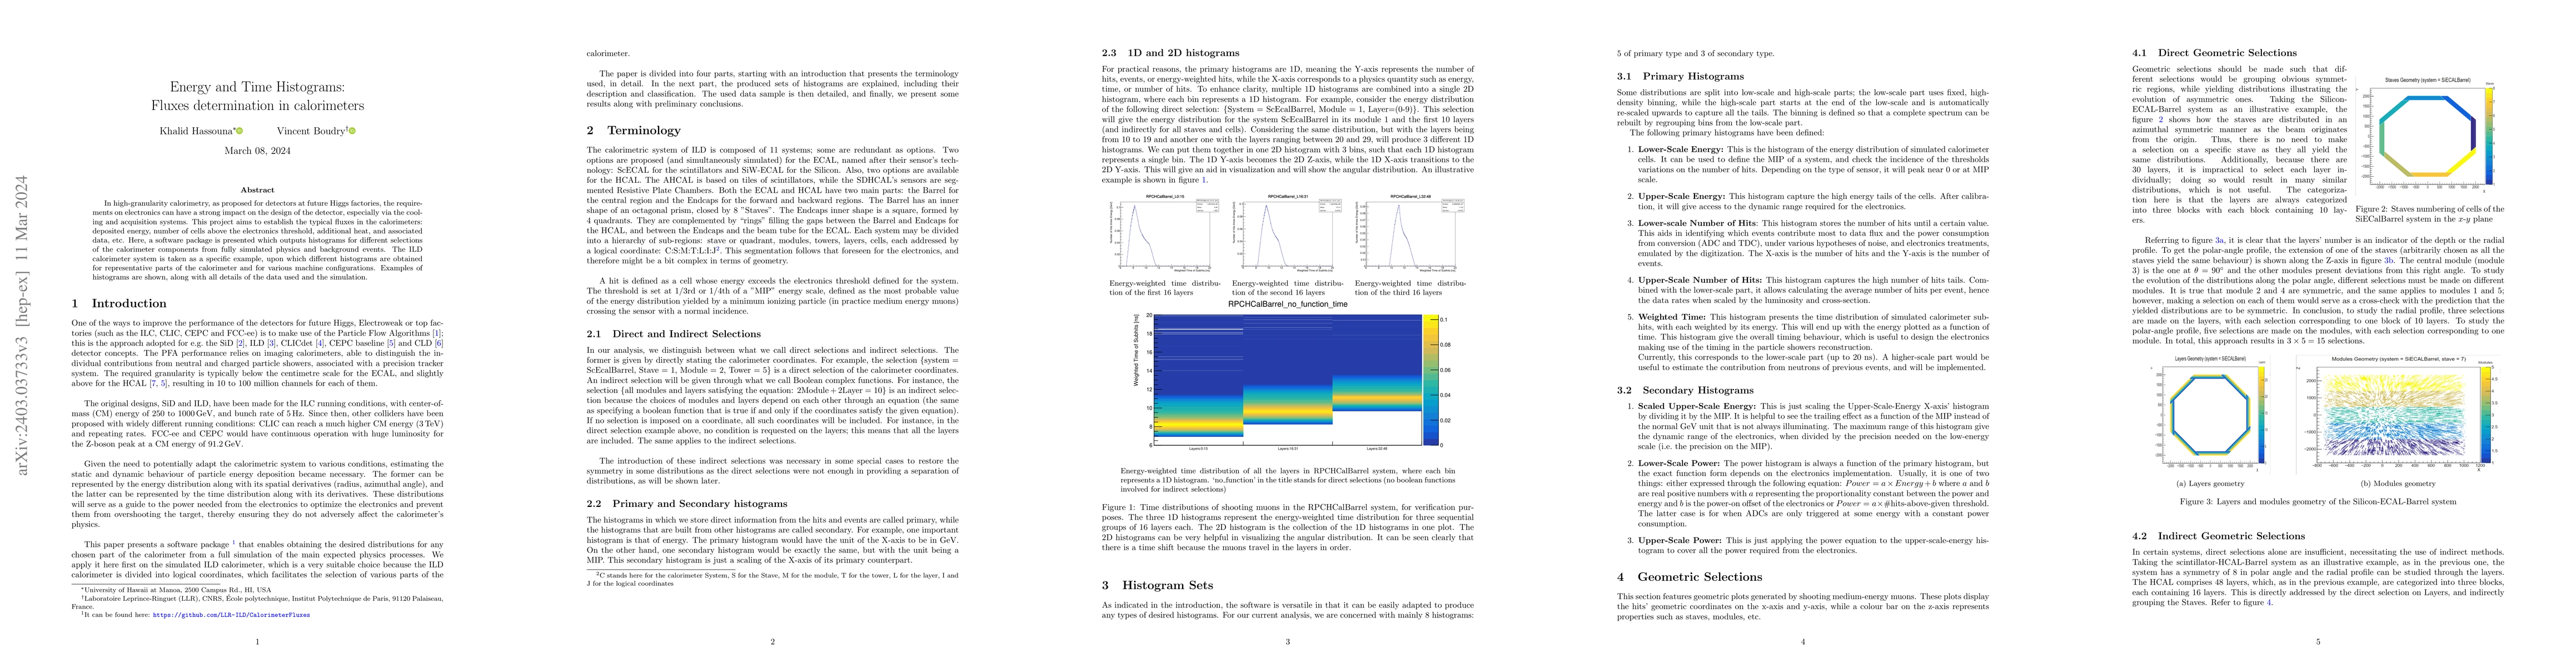
In high-granularity calorimetry, as proposed for detectors at future Higgs factories, the requirements on electronics can have a strong impact on the design of the detector, especially via the cooling and acquisition systems. This project aims to establish the typical fluxes in the calorimeters: deposited energy, number of cells above the electronics threshold, additional heat, and associated data, etc. Here, a software package is presented which outputs histograms for different selections of the calorimeter components from fully simulated physics and background events. The ILD calorimeter system is taken as a specific example, upon which different histograms are obtained for representative parts of the calorimeter and for various machine configurations. Examples of histograms are shown, along with all details of the data used and the simulation.
AI Key Findings
Get AI-generated insights about this paper's methodology, results, and significance.
Paper Details
PDF Preview
Key Terms
Citation Network
Current paper (gray), citations (green), references (blue)
Display is limited for performance on very large graphs.
Similar Papers
Found 4 papersNo citations found for this paper.
Comments (0)