Enhancing Counterfactual Image Generation Using Mahalanobis Distance with Distribution Preferences in Feature Space
Publication
Metrics
AI Quick Summary
This paper proposes a novel method for generating counterfactual images in AI models using Mahalanobis distance and distribution preferences in feature space, enhancing the explainability of image classification decisions. The method outperforms existing baselines, producing counterfactual images that closely resemble the original images.
Paper Preview
Abstract
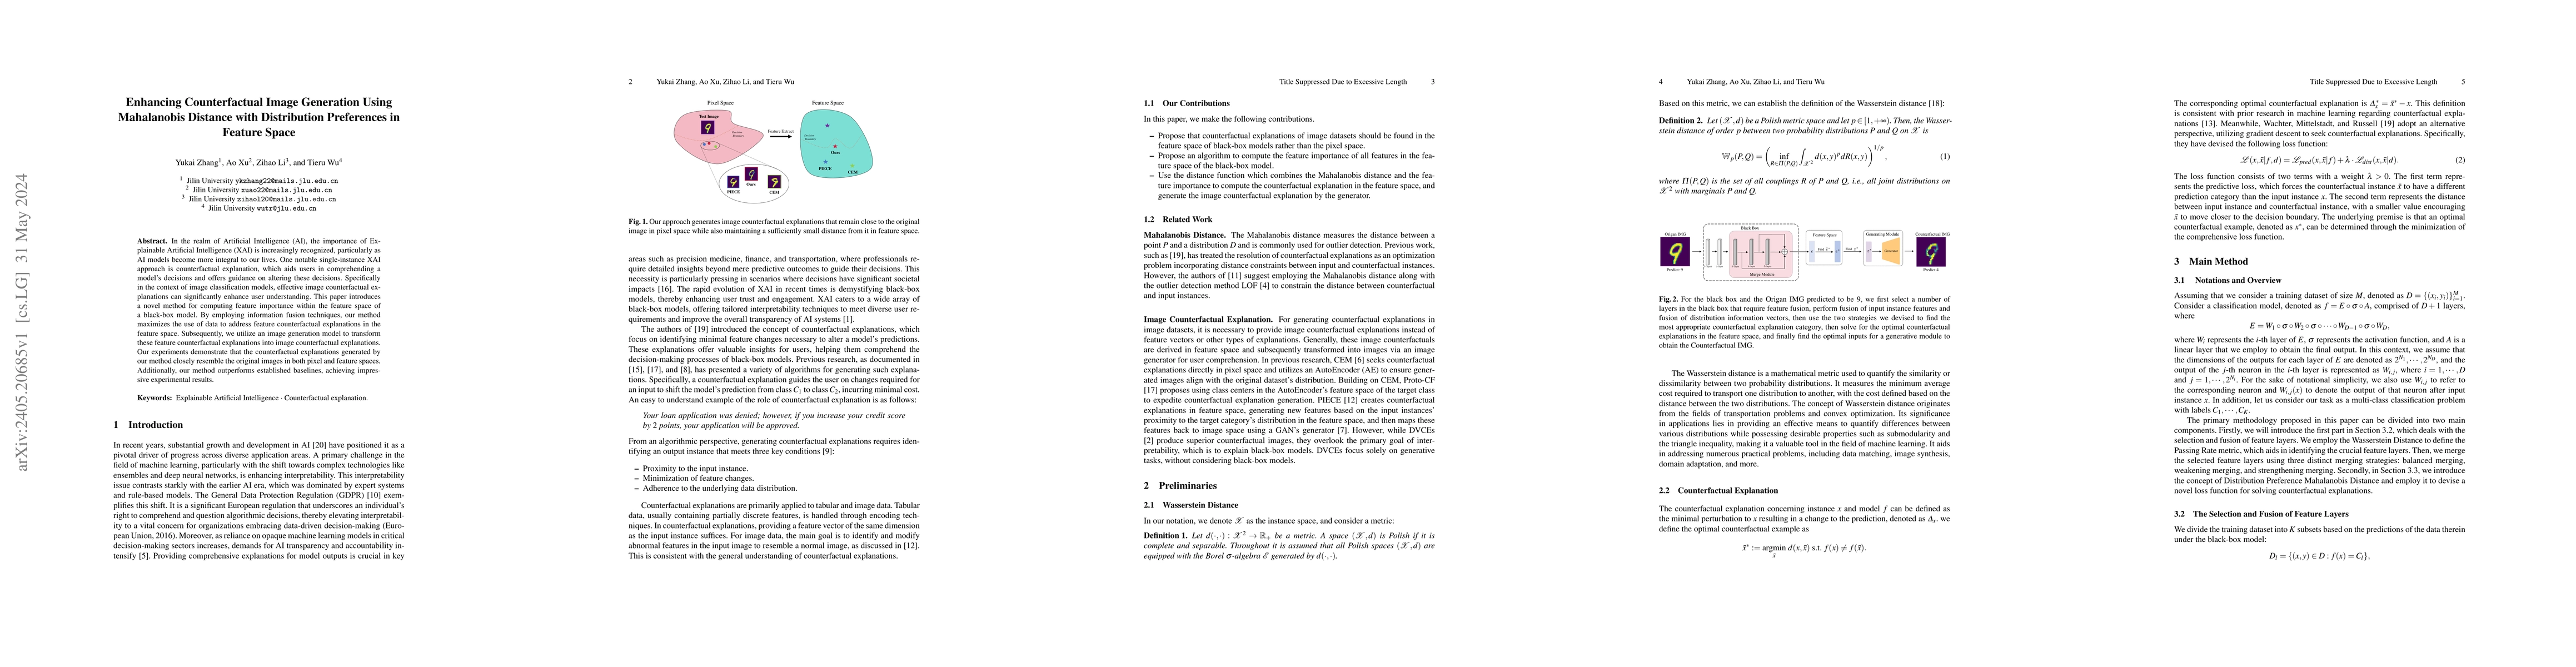
In the realm of Artificial Intelligence (AI), the importance of Explainable Artificial Intelligence (XAI) is increasingly recognized, particularly as AI models become more integral to our lives. One notable single-instance XAI approach is counterfactual explanation, which aids users in comprehending a model's decisions and offers guidance on altering these decisions. Specifically in the context of image classification models, effective image counterfactual explanations can significantly enhance user understanding. This paper introduces a novel method for computing feature importance within the feature space of a black-box model. By employing information fusion techniques, our method maximizes the use of data to address feature counterfactual explanations in the feature space. Subsequently, we utilize an image generation model to transform these feature counterfactual explanations into image counterfactual explanations. Our experiments demonstrate that the counterfactual explanations generated by our method closely resemble the original images in both pixel and feature spaces. Additionally, our method outperforms established baselines, achieving impressive experimental results.
AI Key Findings
Get AI-generated insights about this paper's methodology, results, significance, and more — seven facets brought into focus.
Impact
Paper Details
Authors
PDF Preview
Key Terms
Citation Network
Current paper (gray), citations (green), references (blue)
Display is limited for performance on very large graphs.
Discussion 0