Enhancing Financial VQA in Vision Language Models using Intermediate Structured Representations
Publication
Metrics
AI Quick Summary
This research fine-tunes DEPLOT to convert bar charts into structured tables, enhancing financial VQA using vision language models. The fine-tuned model shows improved accuracy in categorical and numerical interpretation, and the addition of structured representations further boosts large language model reasoning capabilities.
Paper Preview
Abstract
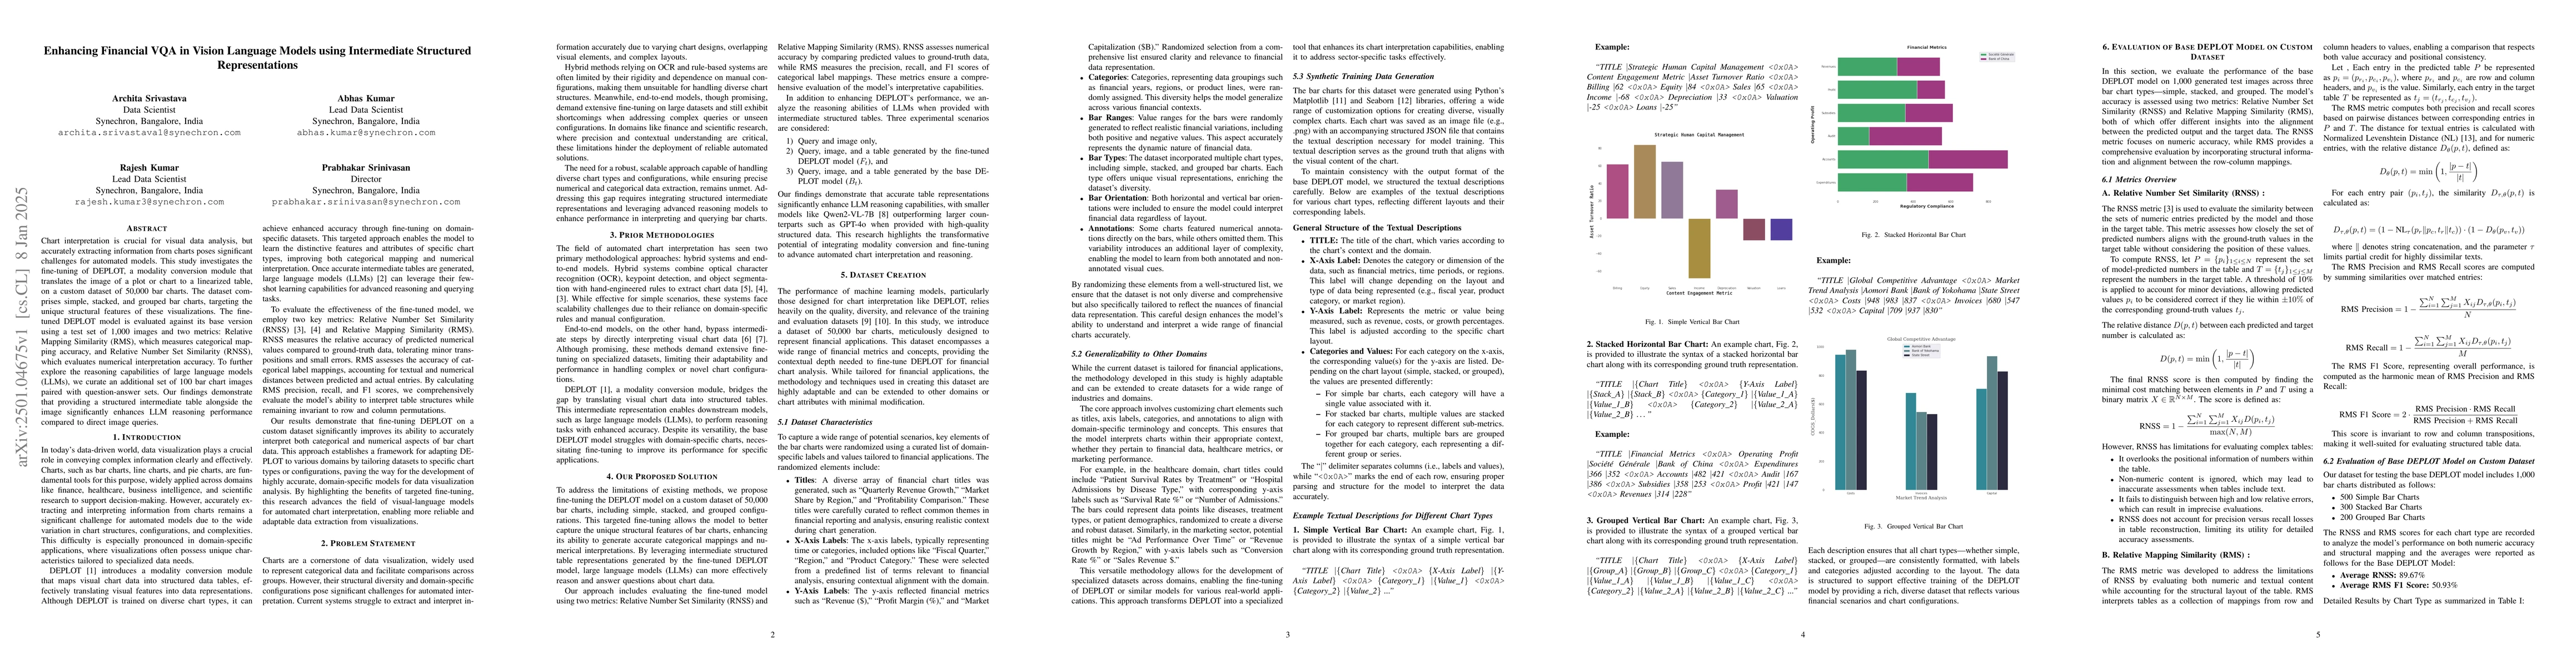
Chart interpretation is crucial for visual data analysis, but accurately extracting information from charts poses significant challenges for automated models. This study investigates the fine-tuning of DEPLOT, a modality conversion module that translates the image of a plot or chart to a linearized table, on a custom dataset of 50,000 bar charts. The dataset comprises simple, stacked, and grouped bar charts, targeting the unique structural features of these visualizations. The finetuned DEPLOT model is evaluated against its base version using a test set of 1,000 images and two metrics: Relative Mapping Similarity (RMS), which measures categorical mapping accuracy, and Relative Number Set Similarity (RNSS), which evaluates numerical interpretation accuracy. To further explore the reasoning capabilities of large language models (LLMs), we curate an additional set of 100 bar chart images paired with question answer sets. Our findings demonstrate that providing a structured intermediate table alongside the image significantly enhances LLM reasoning performance compared to direct image queries.
AI Key Findings
Get AI-generated insights about this paper's methodology, results, significance, and more — seven facets brought into focus.
Impact
Authors
PDF Preview
Citation Network
Current paper (gray), citations (green), references (blue)
Display is limited for performance on very large graphs.
Discussion 0