01
MethodologyHow they did it
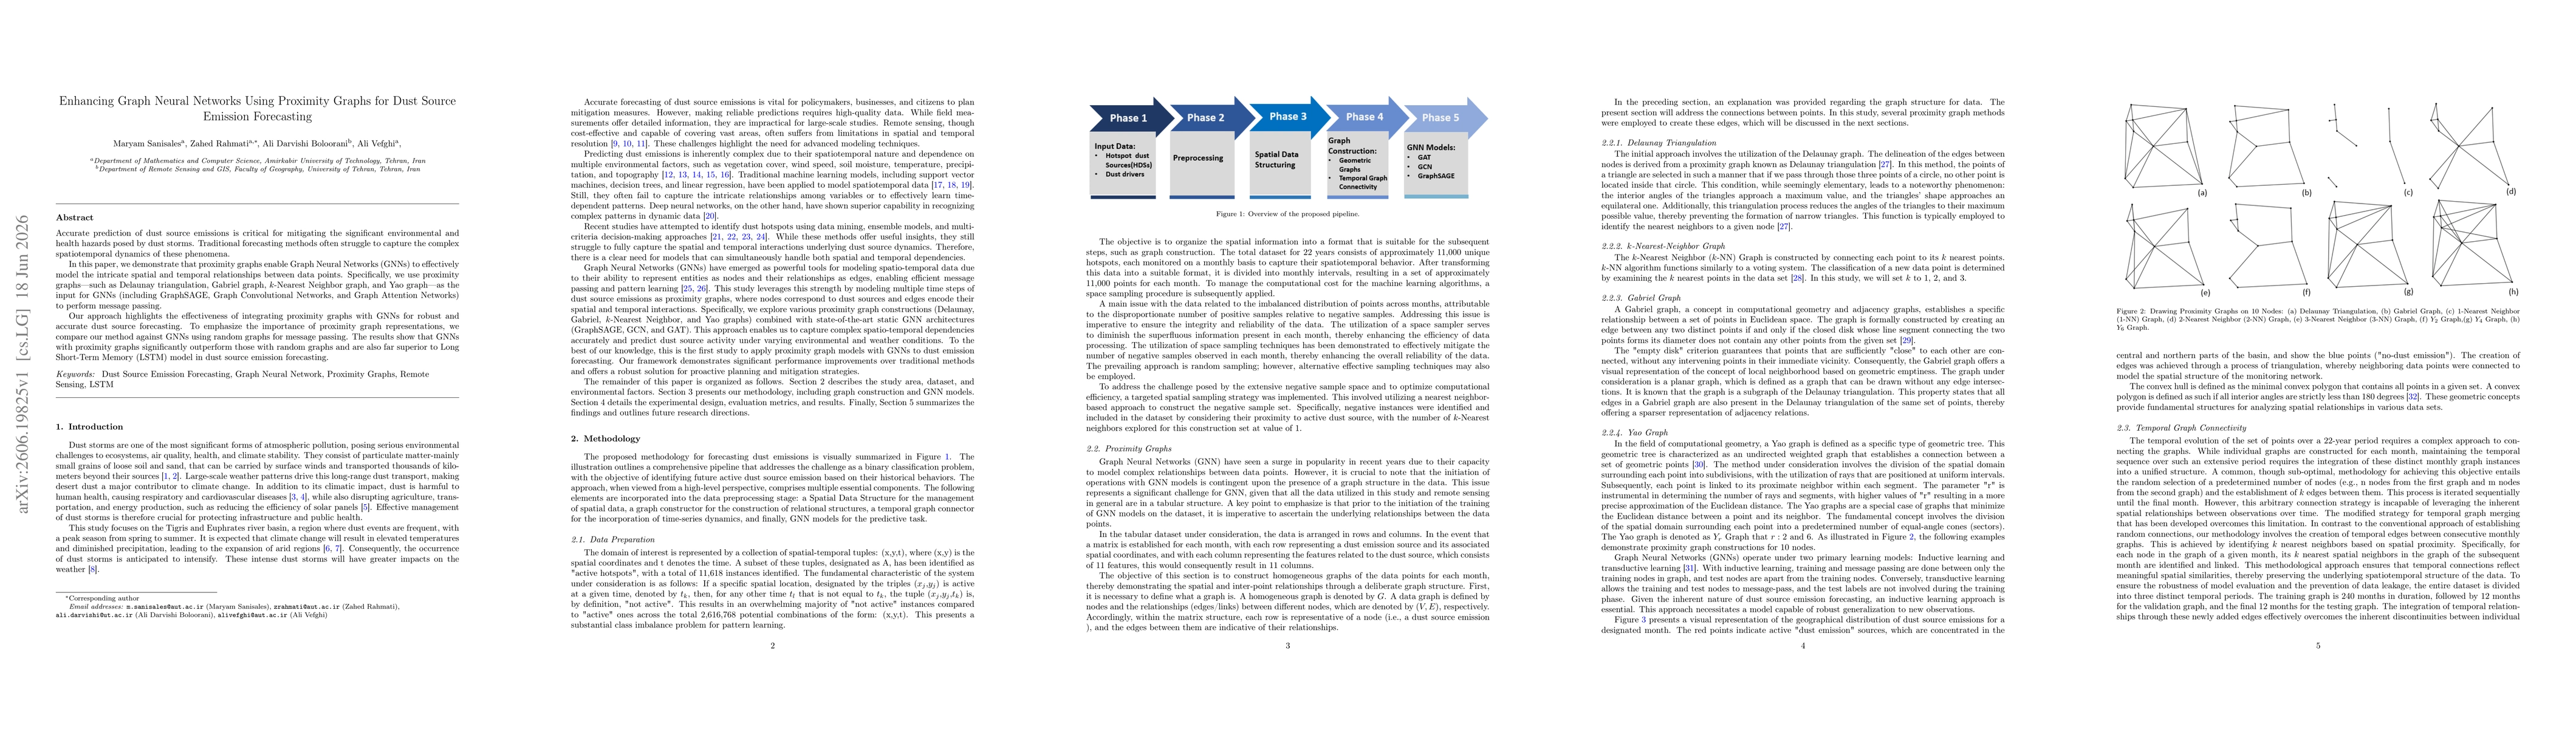
The study constructs proximity graphs (Delaunay, Gabriel, k-NN, Yaograph) to serve as input structures for various GNNs (GraphSAGE, GCN, GAT) to forecast dust source emissions. It treats the forecasting task as spatiotemporal message passing across graph-structured representations, comparing proximity graphs against random graphs to demonstrate benefits, and includes data preprocessing with spatial-temporal tuples and hotspot labeling to address class imbalance.
Discussion 0