Enhancing Question Answering on Charts Through Effective Pre-training Tasks
Publication
Metrics
AI Quick Summary
This paper investigates the limitations of current VisualQA models in understanding charts, particularly in extracting structural and numerical information. It proposes three pre-training tasks to enhance model performance, leading to an average 1.7% improvement over baseline models when evaluated on various chart datasets.
Paper Preview
Abstract
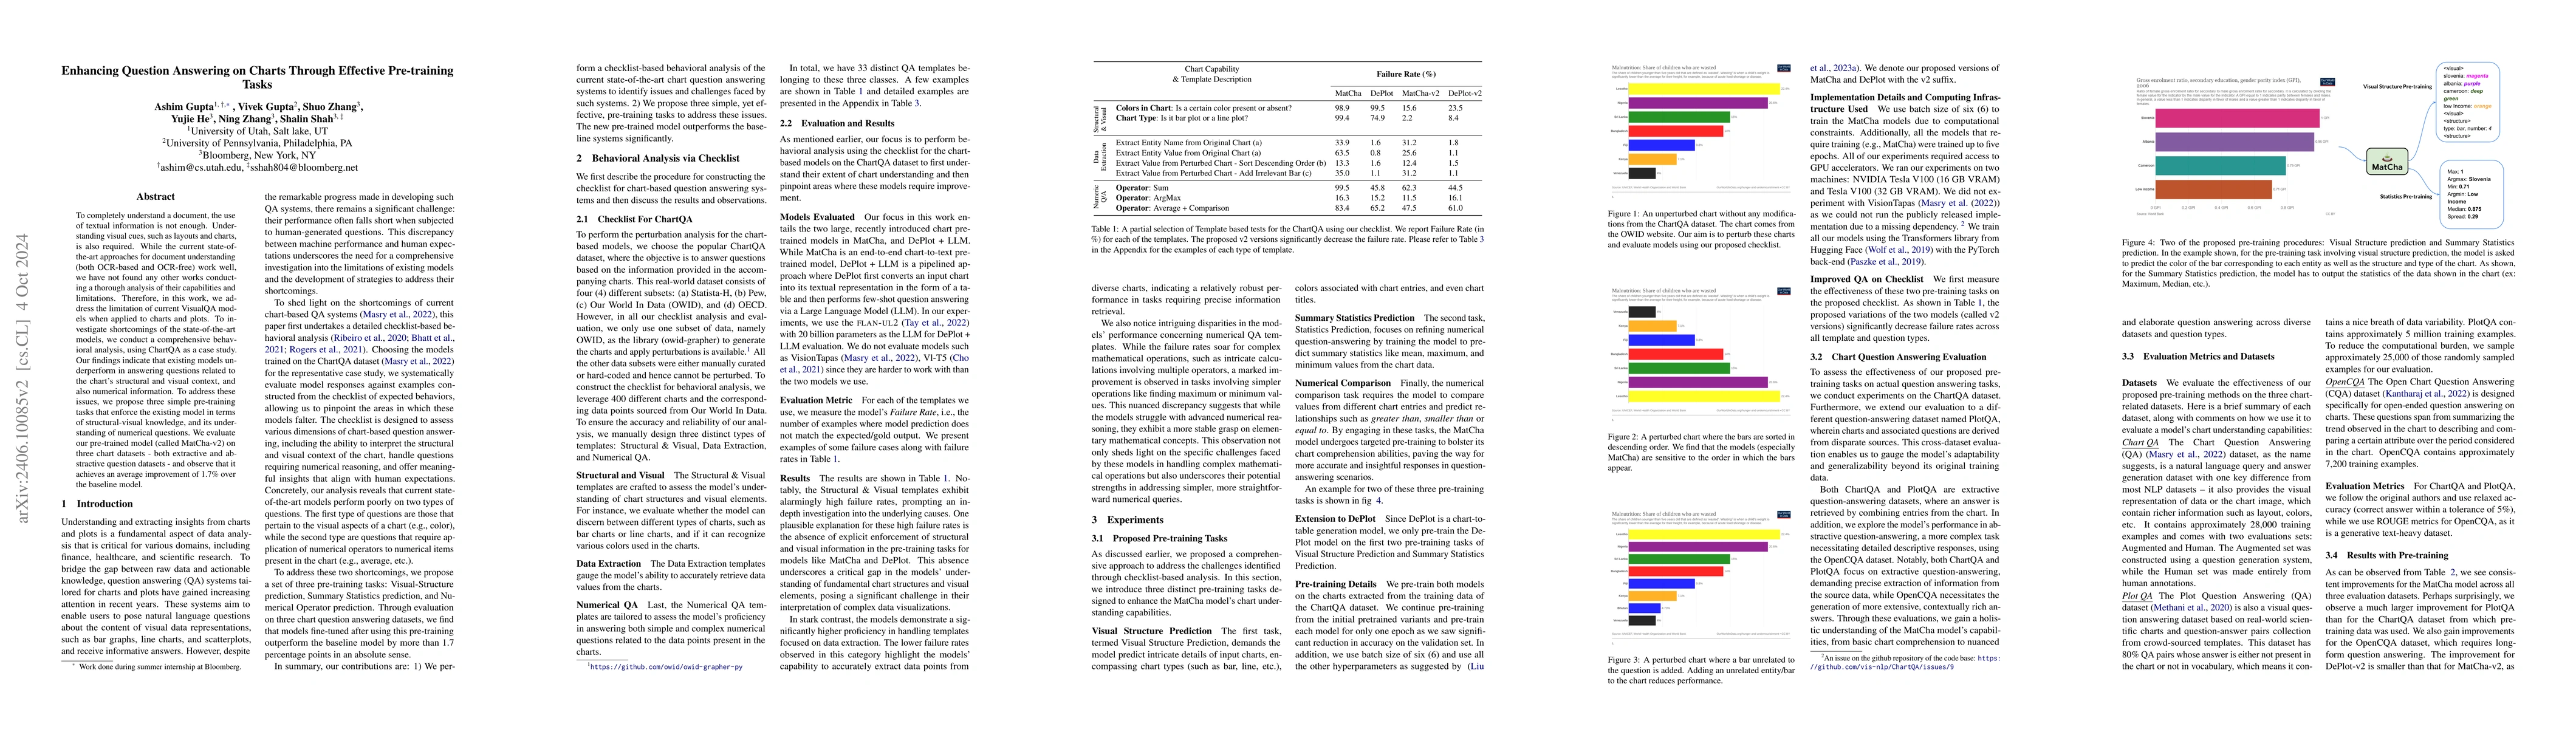
To completely understand a document, the use of textual information is not enough. Understanding visual cues, such as layouts and charts, is also required. While the current state-of-the-art approaches for document understanding (both OCR-based and OCR-free) work well, a thorough analysis of their capabilities and limitations has not yet been performed. Therefore, in this work, we addresses the limitation of current VisualQA models when applied to charts and plots. To investigate shortcomings of the state-of-the-art models, we conduct a comprehensive behavioral analysis, using ChartQA as a case study. Our findings indicate that existing models particularly underperform in answering questions related to the chart's structural and visual context, as well as numerical information. To address these issues, we propose three simple pre-training tasks that enforce the existing model in terms of both structural-visual knowledge, as well as its understanding of numerical questions. We evaluate our pre-trained model (called MatCha-v2) on three chart datasets - both extractive and abstractive question datasets - and observe that it achieves an average improvement of 1.7% over the baseline model.
AI Key Findings
Get AI-generated insights about this paper's methodology, results, significance, and more — seven facets brought into focus.
Impact
Paper Details
Authors
PDF Preview
Key Terms
Citation Network
Current paper (gray), citations (green), references (blue)
Display is limited for performance on very large graphs.
Discussion 0