Enhancing Scientific Visual Question Answering through Multimodal Reasoning and Ensemble Modeling
Publication
Metrics
Paper Preview
Abstract
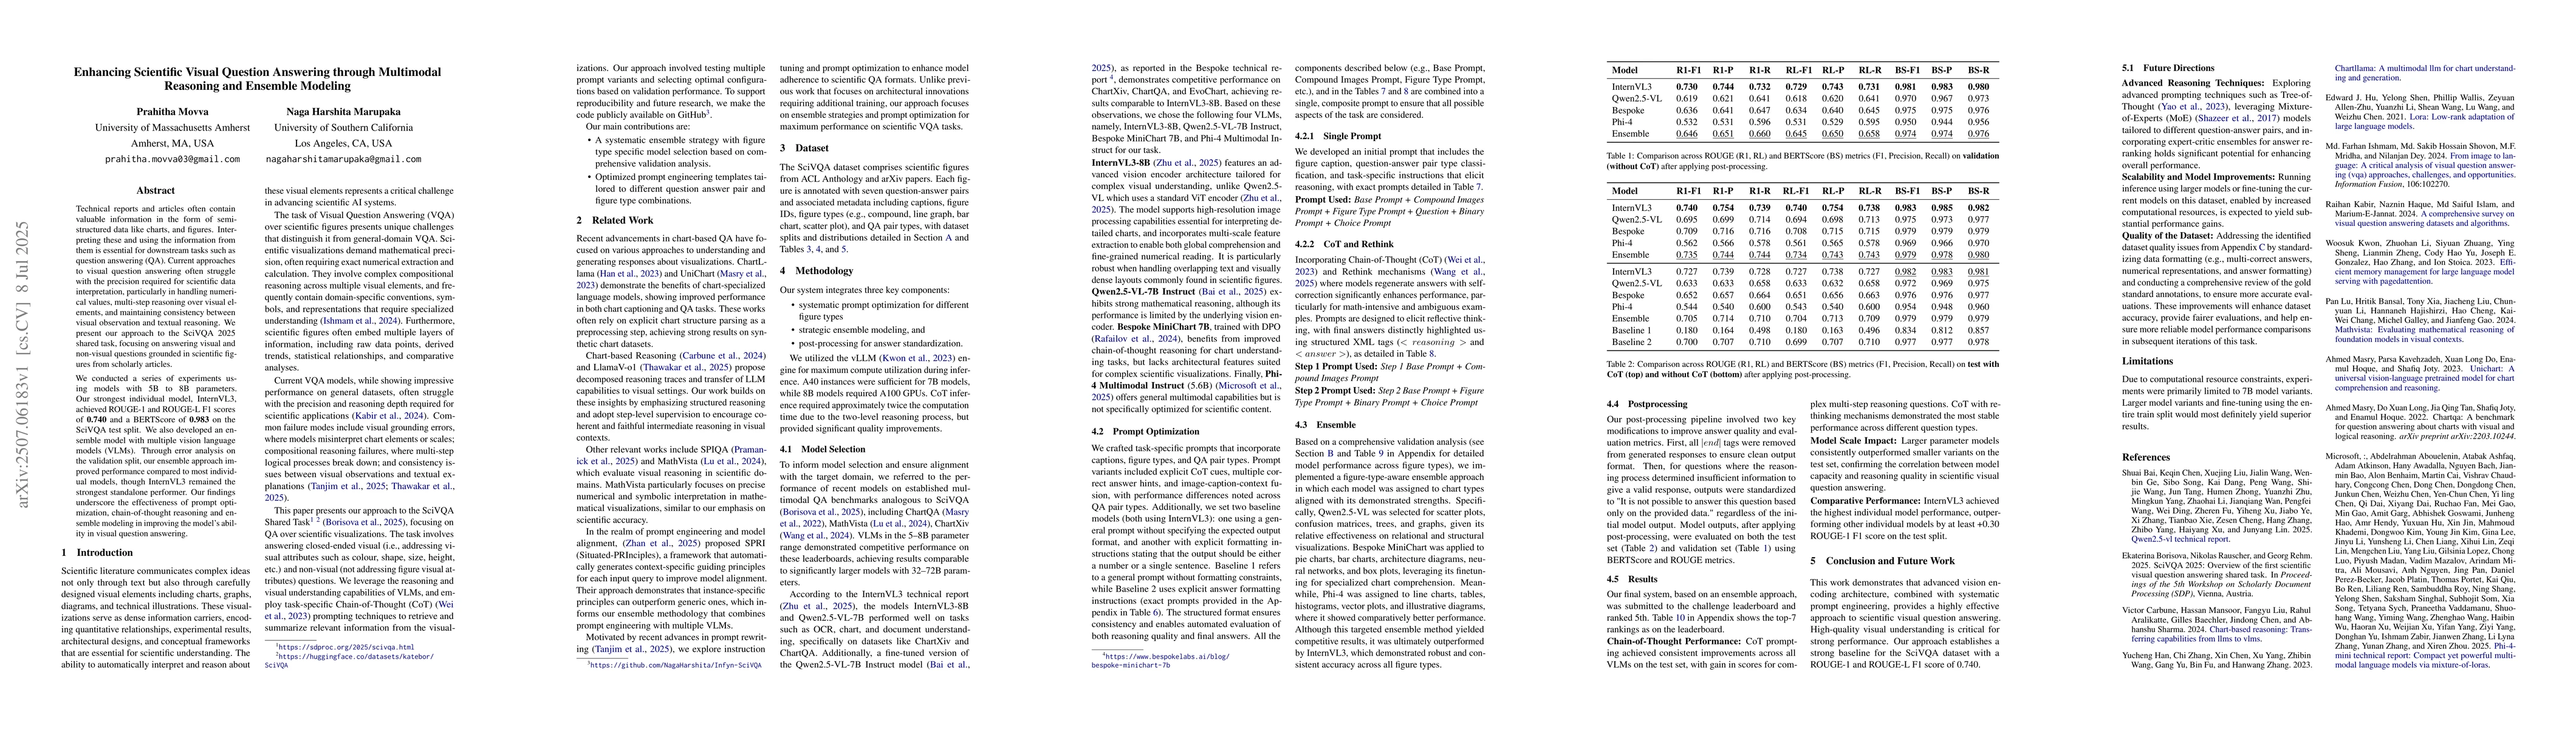
Technical reports and articles often contain valuable information in the form of semi-structured data like charts, and figures. Interpreting these and using the information from them is essential for downstream tasks such as question answering (QA). Current approaches to visual question answering often struggle with the precision required for scientific data interpretation, particularly in handling numerical values, multi-step reasoning over visual elements, and maintaining consistency between visual observation and textual reasoning. We present our approach to the SciVQA 2025 shared task, focusing on answering visual and non-visual questions grounded in scientific figures from scholarly articles. We conducted a series of experiments using models with 5B to 8B parameters. Our strongest individual model, InternVL3, achieved ROUGE-1 and ROUGE-L F1 scores of \textbf{0.740} and a BERTScore of \textbf{0.983} on the SciVQA test split. We also developed an ensemble model with multiple vision language models (VLMs). Through error analysis on the validation split, our ensemble approach improved performance compared to most individual models, though InternVL3 remained the strongest standalone performer. Our findings underscore the effectiveness of prompt optimization, chain-of-thought reasoning and ensemble modeling in improving the model's ability in visual question answering.
AI Key Findings
Get AI-generated insights about this paper's methodology, results, significance, and more — seven facets brought into focus.
Impact
Authors
PDF Preview
Citation Network
Current paper (gray), citations (green), references (blue)
Display is limited for performance on very large graphs.
Discussion 0