Enhancing Uncertainty Communication in Time Series Predictions: Insights and Recommendations
Publication
Metrics
AI Quick Summary
This research investigates how users gauge probabilistic uncertainty in time series predictions using various line chart representations, focusing on individual characteristics and user-reported metrics. The study aims to improve uncertainty communication in forecast visualizations and enhance the design of prediction data dashboards.
Paper Preview
Abstract
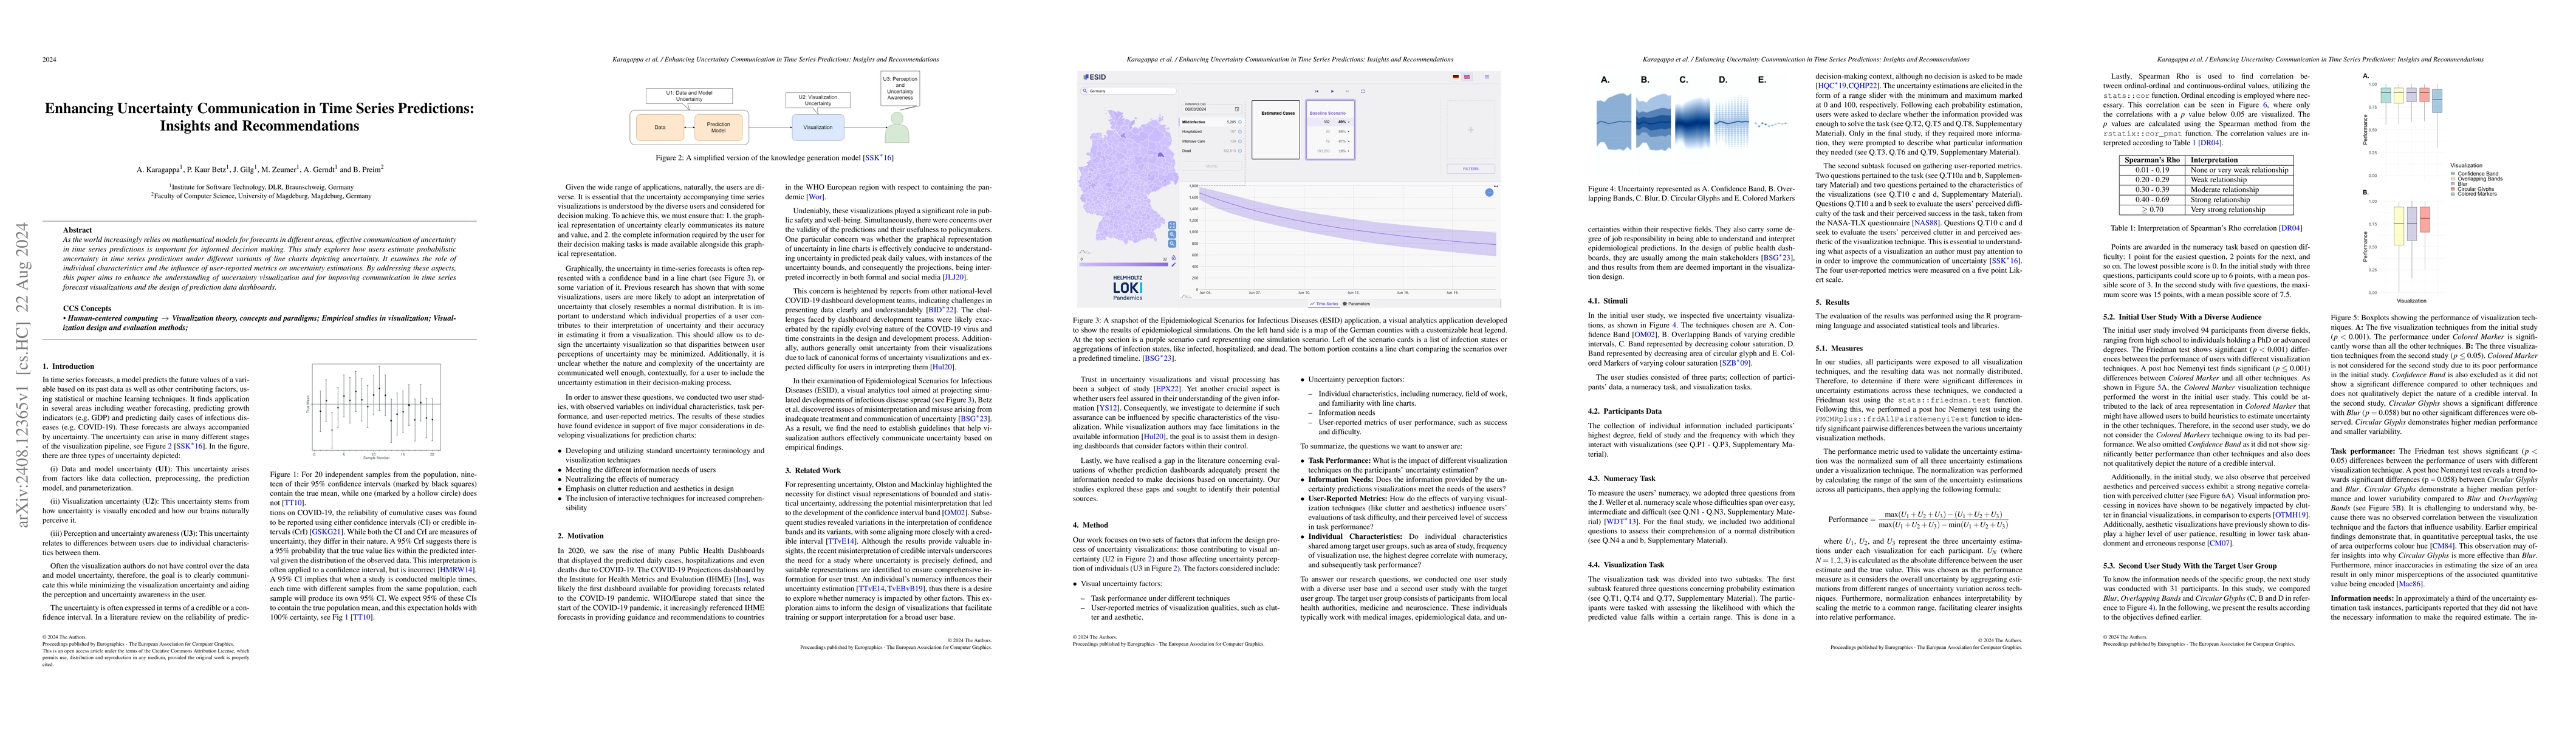
As the world increasingly relies on mathematical models for forecasts in different areas, effective communication of uncertainty in time series predictions is important for informed decision making. This study explores how users estimate probabilistic uncertainty in time series predictions under different variants of line charts depicting uncertainty. It examines the role of individual characteristics and the influence of user-reported metrics on uncertainty estimations. By addressing these aspects, this paper aims to enhance the understanding of uncertainty visualization and for improving communication in time series forecast visualizations and the design of prediction data dashboards.As the world increasingly relies on mathematical models for forecasts in different areas, effective communication of uncertainty in time series predictions is important for informed decision making. This study explores how users estimate probabilistic uncertainty in time series predictions under different variants of line charts depicting uncertainty. It examines the role of individual characteristics and the influence of user-reported metrics on uncertainty estimations. By addressing these aspects, this paper aims to enhance the understanding of uncertainty visualization and for improving communication in time series forecast visualizations and the design of prediction data dashboards.
AI Key Findings
Get AI-generated insights about this paper's methodology, results, significance, and more — seven facets brought into focus.
Impact
Authors
PDF Preview
Citation Network
Current paper (gray), citations (green), references (blue)
Display is limited for performance on very large graphs.
Discussion 0