Background
Graphical Markov models organize multivariate dependencies using graphs. Acyclic digraphs (ADGs), also called directed acyclic graphs, are a key formalism in statistics and related fields (Bayesian networks, influence diagrams, etc.). A core insight is that different ADGs can encode the same set of conditional independencies; such ADGs belong to the same Markov equivalence class. Verma & Pearl (1990, 1992) showed that two ADGs are Markov-equivalent precisely when they share the same skeleton (the underlying undirected graph) and the same immoralities (v-configurations where two edges converge on a common parent). This equivalence notion motivates operating directly on equivalence classes to improve model search efficiency.
The paper documents an empirical, large-scale enumeration effort to quantify the landscape of equivalence classes for ADG models, focusing on the ratio of the number of equivalence classes to the number of ADGs as the number of variates grows. Previous work (Andersson, Madigan, & Perlman 1997; Volf & Studeny 1999) computed counts for small n and offered partial asymptotic insights, but no proven formula or reliable asymptotic description existed. The present study extends the computational frontier to n ≤ 10 and reports systematic patterns in class size distributions, edge-based distributions, and skeleton-related maxima.
Problem / Research Question
The central question asks: for n variates, what is the ratio r of the number of Markov equivalence classes to the number of ADGs, and how does this ratio behave asymptotically? Relatedly, what is the distribution of equivalence classes across edge counts and across class sizes, and what structural properties of skeletons maximize the number of classes or v-configurations? The overarching aim is to understand whether working with classes yields substantial computational gains and to characterize the combinatorial structure of the class space.
Innovation / Contribution
The work combines several methodological innovations to perform a high-precision enumeration up to n = 10:
- A skeleton-first strategy: since Verma & Pearl guarantee that equivalence is determined by skeleton and immoralities, the program generates all unlabeled undirected graphs (skeletons) and then counts the nonisomorphic labelings for each skeleton.
- An orderly algorithm for unlabeled graphs: the generation uses a canonical configuration, an edge-augmentation scheme, and a carefully designed augmentation strategy to enumerate graphs without duplication, exploiting symmetry-breaking rules to prune noncanonical configurations early.
- Efficient labeling counts: for each skeleton, the automorphism group size is computed by enumerating relabelings within degree-same subsets and removing duplicates; the number of labeled graphs is then obtained via n! divided by the automorphism group size (Lagrange’s theorem).
- Direct ADG generation from skeletons: to bypass infeasible explicit enumeration of cyclic digraphs, the program employs Barbosa & Szwarcfiter’s algorithm to generate all acyclic orientations directly from a skeleton.
- Immorality encoding and class-coding: every potential immorality position is encoded as a binary bit, yielding a unique code per equivalence class on a skeleton, which is then used as a key in a red–black tree to accumulate class counts and totals.
- Cross-validation path: the study also reports a second enumeration route that directly enumerates ADGs from skeletons, providing consistency checks across methods.
- Empirical aggregation: results are stratified by vertex count, edge count, and class size, with explicit tabulations and visualizations (described in the text) of distributional patterns.
Methodology / Approach
The workflow follows a two-pronged strategy:
- Skeleton-centric enumeration: For a fixed n, generate all unlabeled graphs (skeletons) using an orderly algorithm. The four rules ensure canonical configurations and avoid gaps in labeling order, facilitating efficient generation. For each skeleton:
- Compute the automorphism group by listing relabelings that preserve vertex degrees and adjacency.
- Derive the number of nonisomorphic labelings as n! divided by the automorphism group size.
- Multiply counts from each skeleton to obtain totals of labeled graphs and, via Verma & Pearl, the number of ADGs and equivalence classes associated with that skeleton.
- Encode immoralities as a bit-coded signature for each class; store in a red–black tree to tally distinct class codes and their sizes.
- Direct ADG generation path: Use Barbosa & Szwarcfiter’s method to generate all ADGs consistent with a given skeleton, then test for immoralities under current orientation and record the corresponding class code.
Across both paths, the program aggregates counts by number of vertices, edges, and class size. Computational effort grows rapidly with n, and the authors report substantial CPU time allocations (roughly 2253 CPU hours for n=10 on mid-1990s hardware).
Experiments / Evaluation
The primary numerical results aggregate the counts of equivalence classes and ADGs up to n=10. Table 1 shows the totals of equivalence classes, the ratio CLIADG (equivalence classes per ADG), and the ratio Cl/Cl (interpreted as a class-level proportion) across n from 1 to 10. The ratio of equivalence classes to ADGs stabilizes near 0.267 as n grows, with n=10 yielding about 0.2680 for the class-to-ADG ratio. The text discusses an asymptotic fit suggesting a limit around 0.26714, acknowledging that no theoretical proof is yet available for this limit.
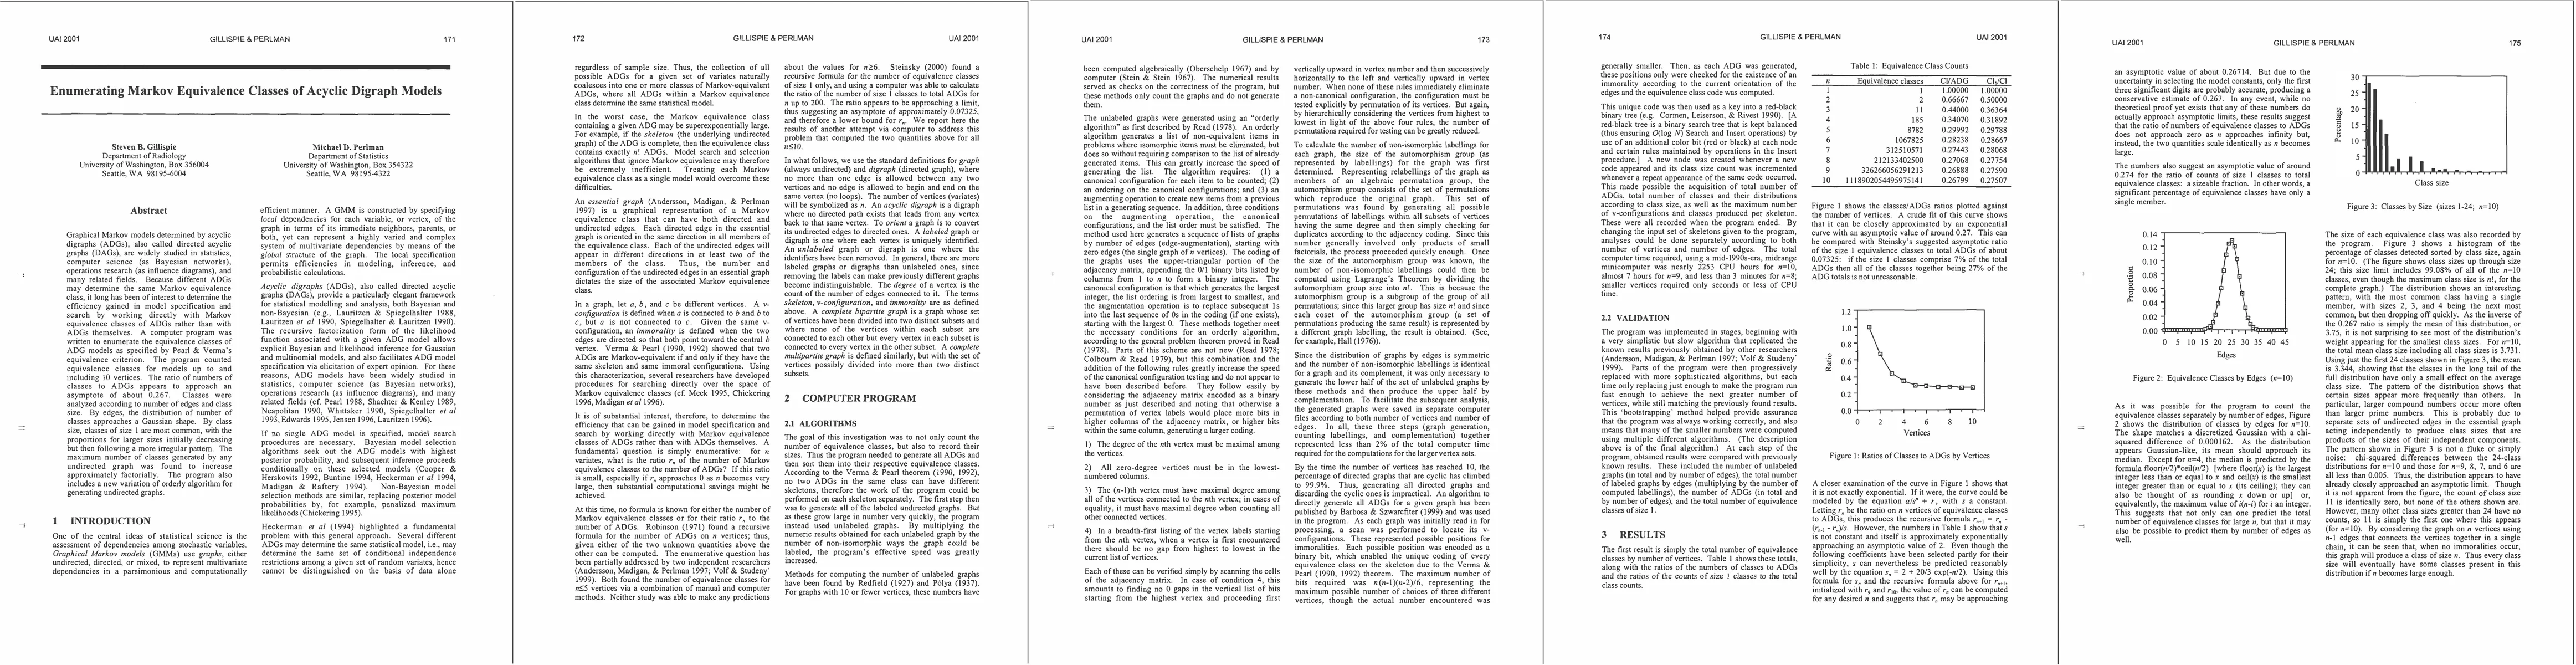
A secondary empirical finding concerns the distribution of class sizes. Figure 3 (described in the text) shows that most classes are small, with size 1 dominating; the mean class size for n=10 is about 3.73 when all sizes are included, and around 3.34 when only the first 24 classes are considered, indicating a short tail that does not heavily skew the average. The authors note that roughly 7% of ADGs are size-1 classes in Steinsky’s prior work, and here the observed long-run proportion for size-1 classes relative to total equivalence classes is around 0.274, suggesting size-1 classes remain a substantial minority.
Edge-distribution analyses reveal a Gaussian-like shape: the number of classes by edges for n=10 concentrates around a mean that tracks i(n−i), the maximum bipartite cut value, with a chi-squared difference indicating a good fit to a discrete Gaussian. The joint mesh of class-size and edge-count distributions (Figure 4) suggests near-independence between the two characteristics across the explored range.
Table 2 reports maxima per skeleton: the maximum number of v-configurations and the maximum number of classes produced by any single skeleton. For n up to 10, the numbers align with the qualitative claims that the maximum v-configurations occur on complete bipartite graphs and that the class-maxima arise from complete multipartite structures, with the latter becoming more complex to predict as n grows. The authors also remark that the maximum number of classes appears to be bounded above roughly by (n−1)!, illustrating the rapid combinatorial growth even when the ratio to ADGs remains bounded away from zero.
Key Results
Key quantitative takeaways include: (i) the asymptotic ratio of equivalence classes to ADGs is nonzero, around 0.267, across n up to 10 and plausibly beyond; (ii) size-1 classes constitute a sizeable fraction (around 0.274) of all classes, indicating a non-negligible singleton component in the class landscape; (iii) the distribution of classes by edges follows a discrete Gaussian, while the distribution by class size is highly skewed toward small sizes with a long tail; (iv) the worst-case class counts per skeleton scale factorially with n, consistent with complete multipartite skeletons; and (v) the computational approach combines skeleton-based counting with direct ADG generation to validate results and to enable cross-checks.
Practical Applications
From a practical standpoint, these results inform model-search strategies that rely on Markov equivalence classes. The finding that the average class size is modest (often below four) implies that limiting searches to equivalence classes would not dramatically reduce the search space in a worst-case sense, though it can still yield substantial savings in average cases. The Gaussian-by-edges pattern and the heavy concentration at small class sizes can guide heuristic search heuristics and sampling plans, suggesting where complexity concentrates and where to allocate computational resources. Moreover, the explicit enumeration by skeletons provides a scalable blueprint for future work, enabling targeted exploration of skeleton topologies that contribute most to the class count or to the tail behavior of the distribution.
Limitations & Considerations
The study is empirical and computational in nature, valid up to n=10. While the authors discuss plausible asymptotic trends, there is no formal proof that the observed ratios converge or that the limiting constants are exact. The results rely on Verma & Pearl’s equivalence criterion; any extension to models with different independence structures or alternative equivalence notions would require re-evaluation. Computational feasibility constrains the scope, and the observed maxima per skeleton may change with more efficient algorithms or hardware. Finally, the practical impact on real-world model search depends on how often the investigated skeletons arise in application domains and whether similar distributional patterns persist for larger, domain-specific DAGs.
Discussion 0