Quick Summary:

The EpiMob system uses big data and visual analytics to simulate and evaluate the impact of human mobility restrictions on controlling COVID-19 spread. Through interactive visualization, users can assess the effectiveness of various policies like regional lockdown and telecommuting, providing insights for policymakers.

Summary

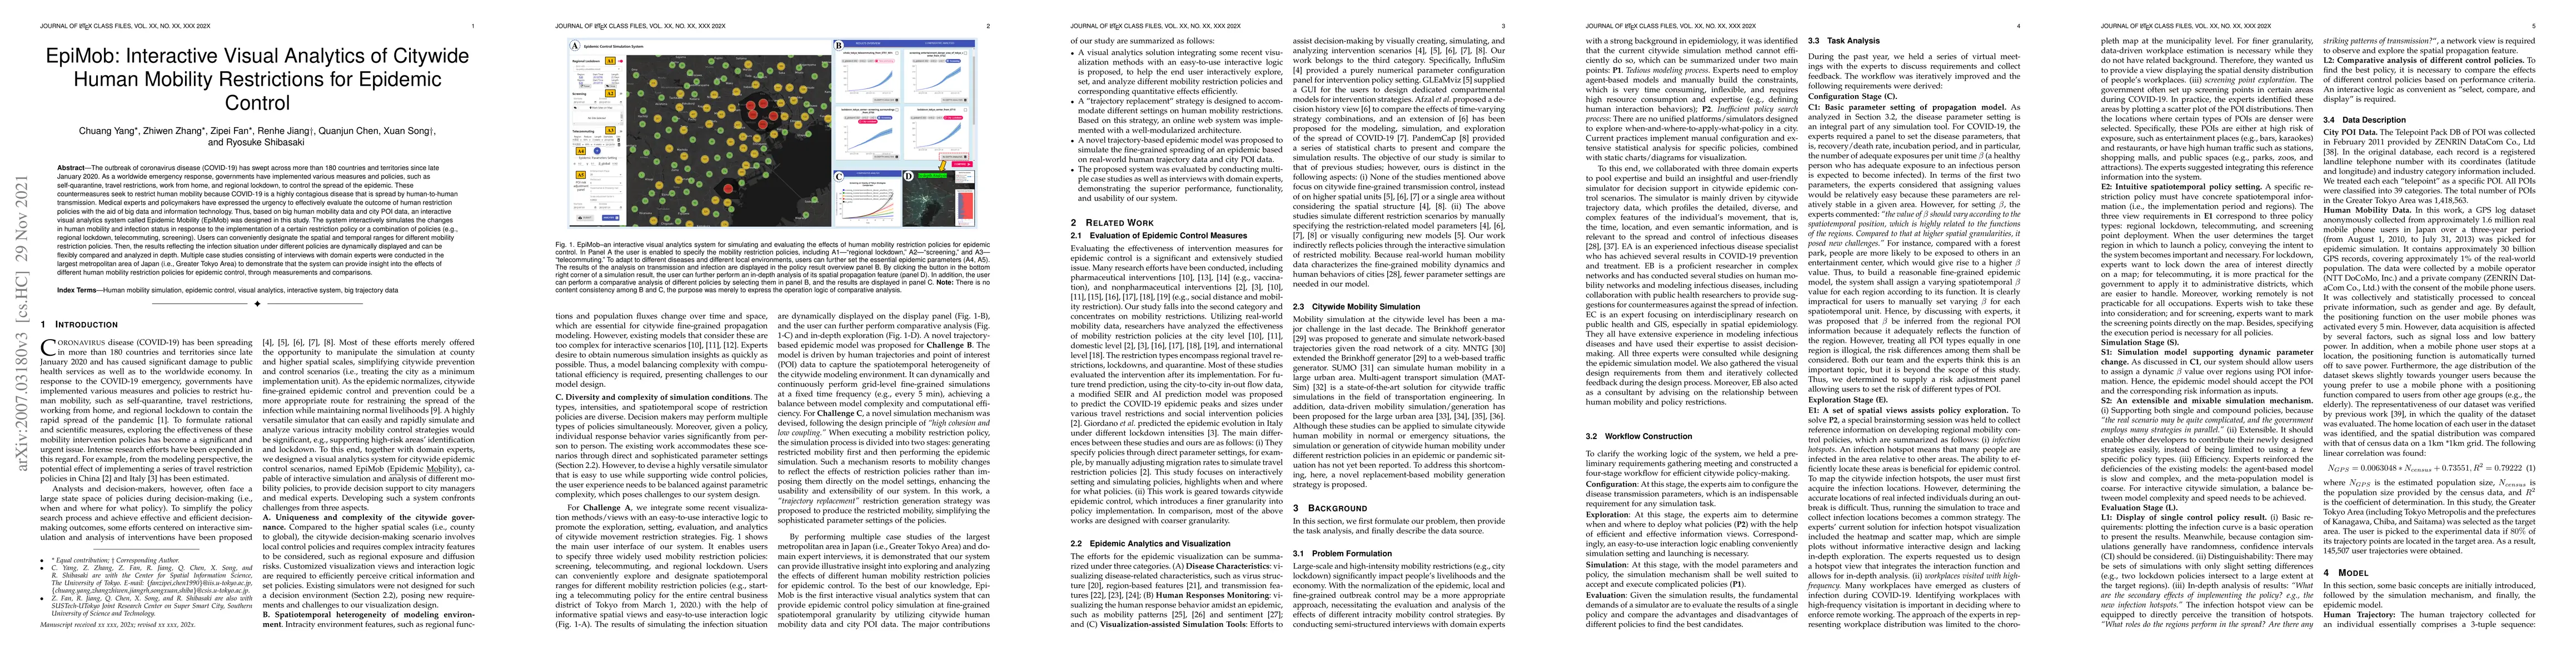
The outbreak of coronavirus disease (COVID-19) has swept across more than 180 countries and territories since late January 2020. As a worldwide emergency response, governments have implemented various measures and policies, such as self-quarantine, travel restrictions, work from home, and regional lockdown, to control the spread of the epidemic. These countermeasures seek to restrict human mobility because COVID-19 is a highly contagious disease that is spread by human-to-human transmission. Medical experts and policymakers have expressed the urgency to effectively evaluate the outcome of human restriction policies with the aid of big data and information technology. Thus, based on big human mobility data and city POI data, an interactive visual analytics system called Epidemic Mobility (EpiMob) was designed in this study. The system interactively simulates the changes in human mobility and infection status in response to the implementation of a certain restriction policy or a combination of policies (e.g., regional lockdown, telecommuting, screening). Users can conveniently designate the spatial and temporal ranges for different mobility restriction policies. Then, the results reflecting the infection situation under different policies are dynamically displayed and can be flexibly compared and analyzed in depth. Multiple case studies consisting of interviews with domain experts were conducted in the largest metropolitan area of Japan (i.e., Greater Tokyo Area) to demonstrate that the system can provide insight into the effects of different human mobility restriction policies for epidemic control, through measurements and comparisons.

AI Key Findings

Get AI-generated insights about this paper's methodology, results, and significance.

Paper Details

PDF Preview

Download PDF

Key Terms

mobility (0.300)
policies (0.294)
policies (0.290)
mobility (0.281)
restriction (0.265)
epidemic (0.252)
restriction (0.252)
human (0.239)
human (0.237)
covid (0.208)
experts (0.185)
covid (0.184)
disease (0.182)
experts (0.179)
disease (0.178)
big (0.175)
big (0.172)
spread (0.169)
spread (0.166)
area (0.142)
Title Authors Year Actions
An improved traffic coordination control integrating traffic flow prediction and optimization
Wei Su, Chaoxu Mu, Lei Xue, Xiaobao Yang, Song Zhu
2025
View Paper
What about thematic information? An analysis of the multidimensional visualization of individual mobility
Aline Menin, Clément Quere, Jorge A. Wagner Filho, S. Chardonnel, Paule-Annick Davoine, Wolfgang Stuerzlinger, Carla Freitas, Luciana P. Nedel, Marco Winckler
2025
View Paper
InclusiViz: Visual Analytics of Human Mobility Data for Understanding and Mitigating Urban Segregation
Yue Yu, Yifang Wang, Yongjun Zhang, Huamin Qu, Dongyu Liu
2025
View Paper
Drillboards: Adaptive Visualization Dashboards for Dynamic Personalization of Visualization Experiences
Sungbok Shin, Inyoup Na, Niklas Elmqvist
2024
View Paper
SIMformer: Single-Layer Vanilla Transformer Can Learn Free-Space Trajectory Similarity
Chuang Yang, Renhe Jiang, Xiaohang Xu, Chuan Xiao, Kaoru Sezaki
2024
View Paper
Epidemiology-Aware Neural ODE with Continuous Disease Transmission Graph
Guancheng Wan, Zewen Liu, Max S. Y. Lau, B. A. Prakash, Wei Jin
2024
View Paper
CSLens: Towards Better Deploying Charging Stations via Visual Analytics — a Coupled Networks Perspective
Yutian Zhang, Liwen Xu, Shaocong Tao, Quanxue Guan, Qu Li, Haipeng Zeng
2024
View Paper
Human factors methods in the design of digital decision support systems for population health: a scoping review
Holland M. Vasquez, Emilie Pianarosa, Renee Sirbu, Lori M. Diemert, Heather Cunningham, V. Harish, Birsen Donmez, Laura C. Rosella
2024
View Paper
Impact of interaction technique in interactive data visualisations: A study on lookup, comparison, and relation-seeking tasks
N. V. Berkel, Benjamin Tag, R. Jacobsen, Daniel Russo, H. Purchase, Daniel Buschek
2024
View Paper
HexTiles and Semantic Icons for MAUP-Aware Multivariate Geospatial Visualizations
Yuya Kawakami, Sarah Yuniar, Kwan-Liu Ma
2024
View Paper
Assessing the landscape of toolkits, frameworks, and authoring tools for urban visual analytics systems
L. Ferreira, Gustavo Moreira, Maryam Hosseini, Marcos Lage, Nivan Ferreira, Fabio Miranda
2024
View Paper
A Review of Graph Neural Networks in Epidemic Modeling
Zewen Liu, Guancheng Wan, B. A. Prakash, Max S. Y. Lau, Wei Jin
2024
View Paper
Visualization of Spatial–Temporal Epidemiological Data: A Scoping Review
Denisse Kim, Bernardo Cánovas-Segura, Manuel Campos, Jose M. Juarez
2024
View Paper
Visualizing Large-Scale Spatial Time Series with GeoChron
Zikun Deng, Shifu Chen, T. Schreck, Dazhen Deng, Tan Tang, Mingliang Xu, Di Weng, Yingcai Wu
2023
View Paper
Cluster-Aware Grid Layout
Yuxing Zhou, Weikai Yang, Jiashu Chen, Changjian Chen, Z. Shen, Xiaonan Luo, Lingyun Yu, Shixia Liu
2023
View Paper
MepoGNN: Metapopulation Epidemic Forecasting with Graph Neural Networks
Qi Cao, Renhe Jiang, Chuang Yang, Z. Fan, Xuan Song, R. Shibasaki
2023
View Paper
Investigating Animal Infectious Diseases with Visual Analytics
Yun-Hsin Kuo, B. Martínez-López, K. Ma
2023
View Paper
ClinicLens: Visual Analytics for Exploring and Optimizing the Testing Capacity of Clinics given Uncertainty
Yu Dong, Jie Liang, Longbing Cao, D. Catchpoole
2023
View Paper
Metropolitan-scale Mobility Digital Twin
Z. Fan, Renhe Jiang, R. Shibasaki
2023
View Paper
Real-time estimation and forecasting of COVID-19 cases and hospitalizations in Wisconsin HERC regions for public health decision making processes
Srikanth R Aravamuthan, Juan Francisco Mandujano Reyes, B. Yandell, D. Döpfer
2023
View Paper
Understanding railway usage behavior with ten million GPS records
Yanxiu Jin, Peiran Li, Zhiheng Chen, Shreyas P. Bharule, Ning Jia, Jinyu Chen, Xuan Song, R. Shibasaki, Haoran Zhang
2023
View Paper
Multilevel Visual Analysis of Aggregate Geo-Networks
Zikun Deng, Shifu Chen, Xiao Xie, Guodao Sun, Mingliang Xu, Di Weng, Yingnian Wu
2022
View Paper
A Multiscale Geospatial Dataset and an Interactive Visualization Dashboard for Computational Epidemiology and Open Scientific Research
Muhammad Usman, Honglu Zhou, Seonghyeon Moon, Xun Zhang, P. Faloutsos, M. Kapadia
2022
View Paper
Individual-based epidemiological model of COVID19 using location data
Yoriyuki Yamagata, Shunki Takami, Keisuke Yamazaki, T. Nakaya, Masaki Onishi
2022
View Paper
The Impact of COVID-19 on Human Mobility: A Case Study on New York
Xinchen Hao, Renhe Jiang, Jiewen Deng, Xuan Song
2022
View Paper
A Survey on Data-driven COVID-19 and Future Pandemic Management
Yudong Tao, Chuang Yang, Tianyi Wang, Erik Coltey, Yanxiu Jin, Yinghao Liu, Renhe Jiang, Z. Fan, Xuan Song, R. Shibasaki, Shu-Ching Chen, Mei-Ling Shyu, Steven Luis
2022
View Paper
BIG TRAJECTORY DATA: A DISTRIBUTED COMPUTING PERSPECTIVE
B. Anbaroğlu, Y. Alter
2022
View Paper
User-centered visual explorer of in-process comparison in spatiotemporal space
Dong Yu, Ian Oppermann, Jie Liang, Xiaoru Yuan, Nguyen Quang Vinh
2022
View Paper
Epidemic versus economic performances of the COVID-19 lockdown: A big data driven analysis
Haoran Zhang, Peiran Li, Zhiwen Zhang, Wenjing Li, Jinyu Chen, Xuan Song, R. Shibasaki, Jinyue Yan
2021
View Paper
A Visual Analytics Based Decision Making Environment for COVID-19 Modeling and Visualization
S. Afzal, Sohaib Ghani, H. Jenkins‐Smith, David Ebert, Markus Hadwiger, I. Hoteit
2020
View Paper

Comments (0)

This website uses cookies to ensure you get the best experience. Learn more